Before reading this article, check out these basic guidelines for ensuring good data collection which are universally applicable. Now we will get a bit more focused, and talk about signal specific data quality issues that can arise and how to deal with them.
Disclaimer: Labeling data “good” or “bad” is somewhat subjective – and many times even “bad” data is still usable, albeit with a significant time commitment in signal editing during analysis. Sometimes, based on the protocol or what actions the subject is performing, certain types of noise are unavoidable. Your data don’t always have to look perfect, and this article simply contains the steps you should take to ensure you are recording the best data possible.
Electrocardiogram (ECG, or EKG)
Let’s take a moment to review the ideal morphology, or shape, of the ECG signal:
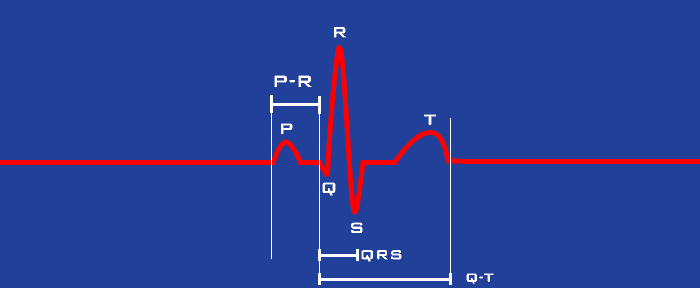
Here we see a few easily identifiable landmarks. P waves are not always highly pronounced, but the QRS complex (consisting of the Q trough, R peak, and S trough), and T wave should be clear identifiers of good quality ECG recording. Of all these landmarks, the R peak is the most important identifiable point, the timing of which is used extensively for Heart Rate Variability and Impedance Cardiography analysis. For more information on the ECG signal and it’s characteristics, take a look at this blog series.
Good Quality Data
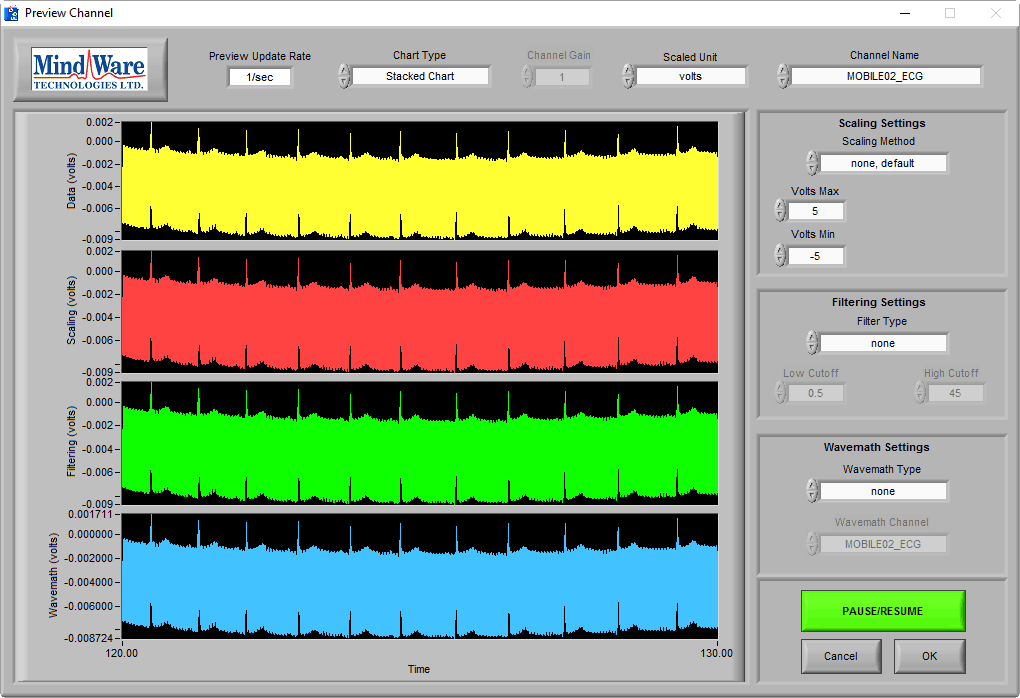
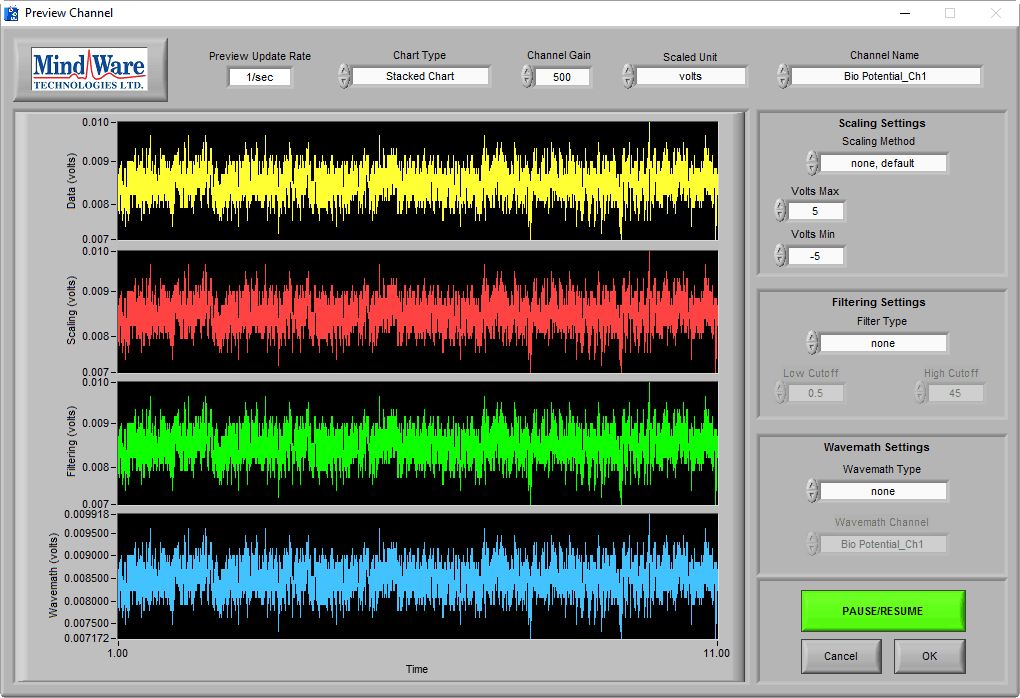
On the BioLab preview screen, we can see that, while the signal does not exactly mirror the above artistic rendition of the ECG, the main landmarks are identifiable across multiple cycles of ECG:
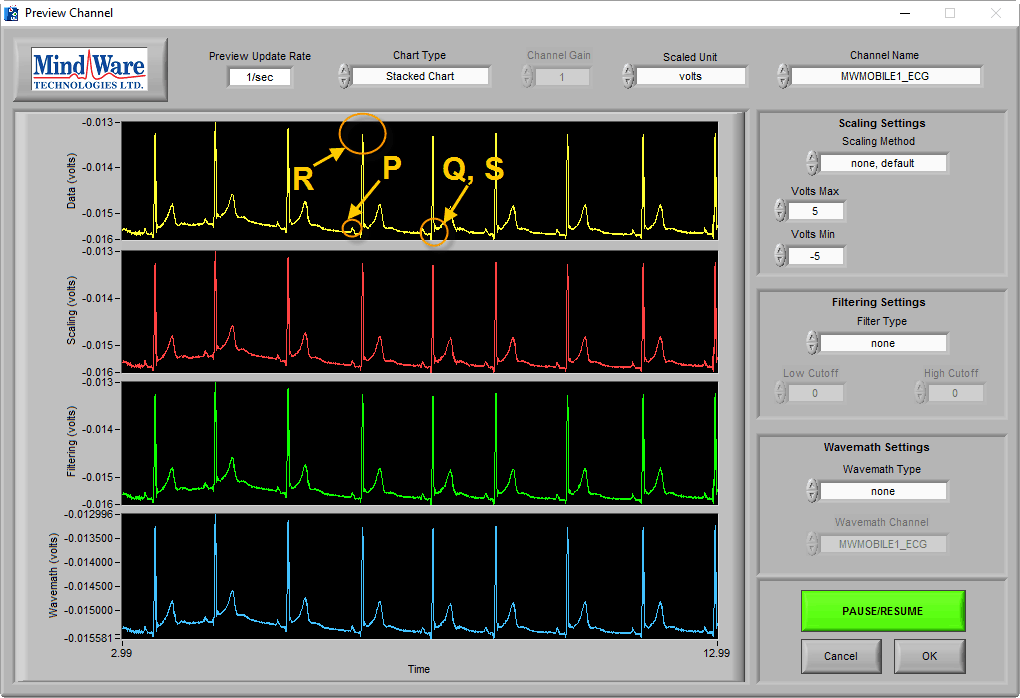
This is a beautiful ECG signal. If you can acquire data that looks this clean you will save a ton of time in analysis.
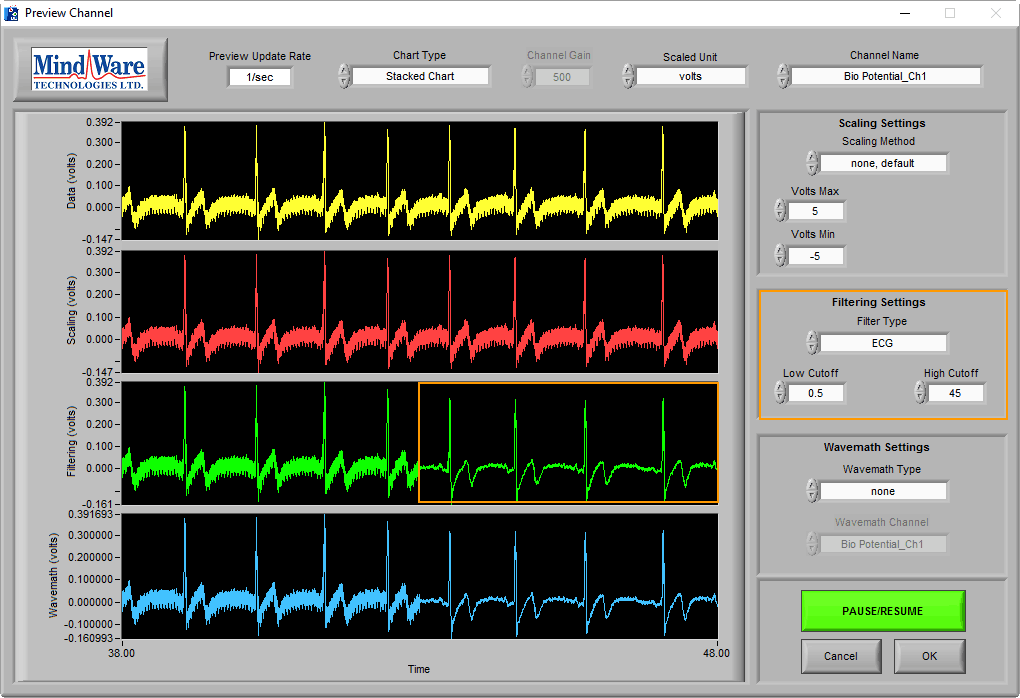
The above data was collected using the MindWare Mobile Impedance Cardiograph. Without getting too technical, the MW Mobile uses what is referred to as a DC-coupled signal amplifier. The Impedance Cardiography & GSC module for the BioNex, on the other hand, uses an AC coupled amplifier and results in a slightly different signal morphology:
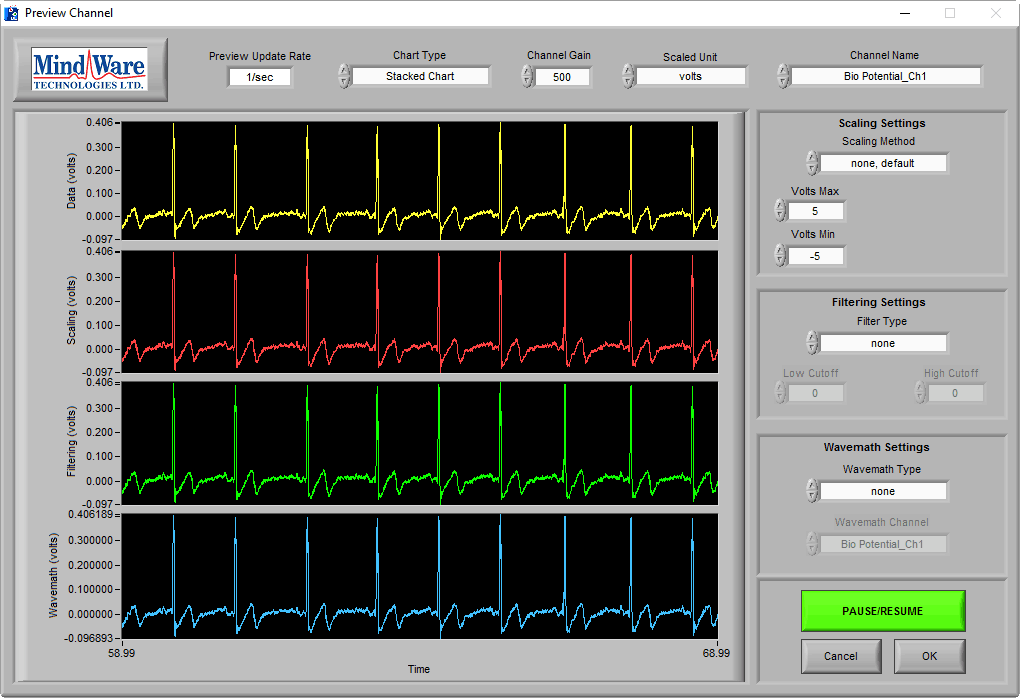
This is not a bad thing, it is just different. We can still see all the important landmarks on this signal, which are the most important thing to look for with ECG data.
Poor Quality Data
Now that we have looked at some examples of good quality ECG, lets examine some commonly experienced signal quality issues and how to address them.
50/60 Hz Noise
50/60 Hz noise, also known as electrical interference, is a common problem due to the amount of equipment in and around lab spaces today. Alternating current (AC) electricity runs at a frequency of 60 Hz in North America, but much of the rest of the world runs at 50 Hz. In either case, this noise will manifest in the data in the following way:
Depending on the proximity to the electrical source, this noise can become significant enough to hide all distinguishable features of the ECG cycle, including the R peak:
The best course of action here is to find the source of the noise:
- Are the lead wires or subject harness in contact with any electrical cables? Are they near a computer monitor or other large electronic device?
- Are there electrical cables running under the subject’s feet?
- If using a MindWare Mobile, is the Mobile plugged in using a non-standard power supply?
- Are there large fluorescent lights in the room? Try turning them off, does the noise go away?
These are far from the only causes of electrical noise, but a place to start. Make a reasonable effort to remove sources of noise, but if there is still noise in the data, you can try applying a 50/60 Hz Notch filter or ECG filter to reduce the influence of the undesirable frequency range:
Inverted Signal
As we know from the above morphology guidelines, the R peak is a sharp upward spike on the ECG signal. But what if the signal appears to be upside down on the Preview screen?
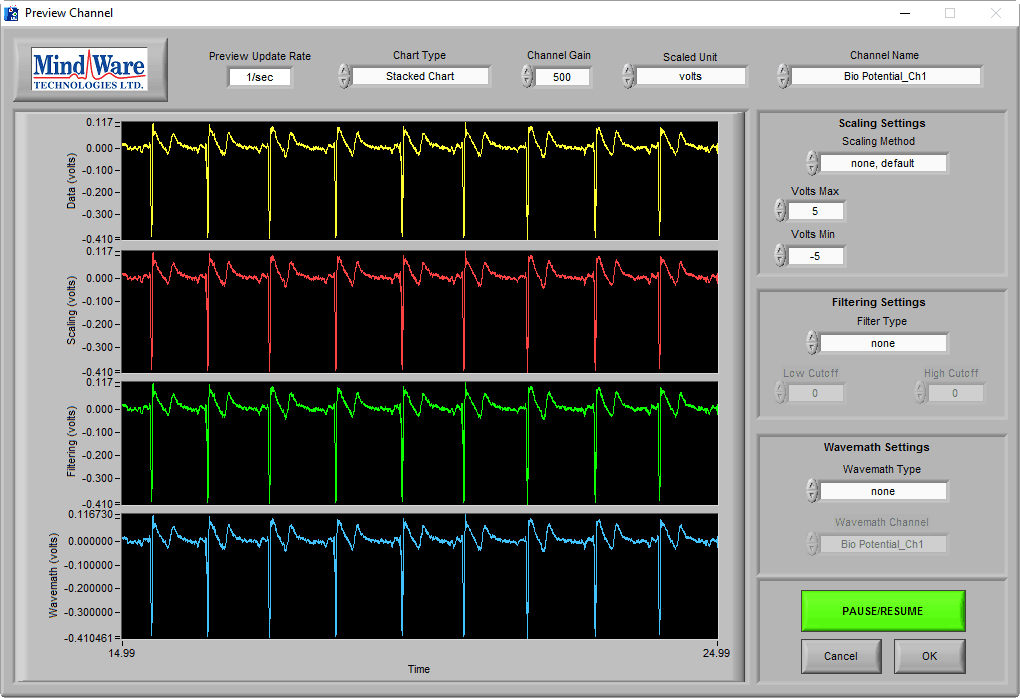
There is (most likely) nothing wrong with your subject’s heart – rather, it is a case of the positive and negative ECG leads being swapped. The ECG signal is unintuitive in that the negative lead goes higher on the body – and having these swapped will result in an inverted signal. To fix this, simply swap them back to the correct positions and everything should be fine. To help prevent this in the first place, print a copy of the Electrode Placement poster and put it up in the lab.
Note: For the sake of subject comfort, it is best to swap the leads where they plug into the acquisition hardware (or subject harness) rather than remove them from the attached electrodes.
If you didn’t notice this until you started recording, it is ok – there are options in the analysis applications to invert the signal. Don’t swap leads in the middle of the recording! It will be easier to just invert the entire signal during analysis, rather than having some segments which are inverted and others which are not.
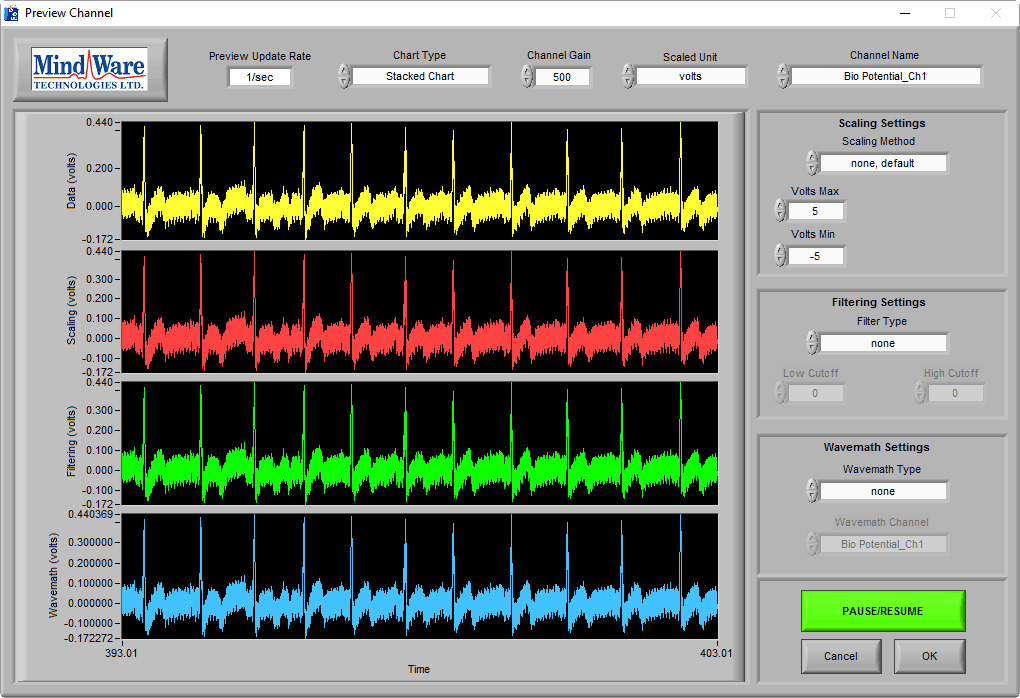
Poor Electrode Contact
If the subject moves slightly and the signal immediately becomes unstable, chances are you have electrode connectivity issues
There are a few culprits for this problem
- Dry/poorly adhered electrodes
- Unsecured lead wire
- Non-ideal electrode placement
To remedy this, make sure you are always using fresh, wet electrodes, secure the lead wire with tape, and practice proper electrode placement technique. For more on all of these topics, check out this instructional video.
Note: This is one of those cases where some noise, depending on the task being performed, will be unavoidable. Do your best to minimize the effect it has on the data, and the rest can hopefully be dealt with during analysis (see this post on how this is done).
No Signal
This may go without saying, but it is also important to recognize the absence of signal. It can look something like this:
Clearly there are no recognizable characteristics of an ECG signal here. When this occurs make sure your electrodes are fresh and properly adhered to the skin, leads are connected to the recording hardware, and that your gain is set appropriately.
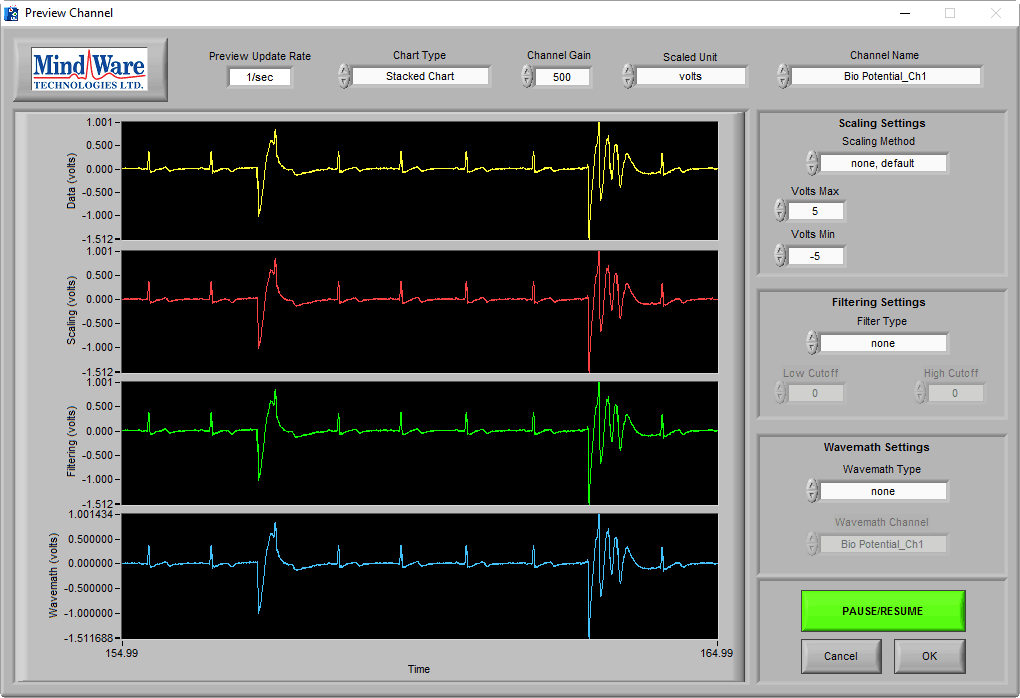
Clipping
Speaking of gain, setting your gain too high can result in something known as clipping or railing, which is when the signal amplitude exceeds the range allowed by the recording hardware. It is can be identified by a flat line at the highest/lowest points of a signal:
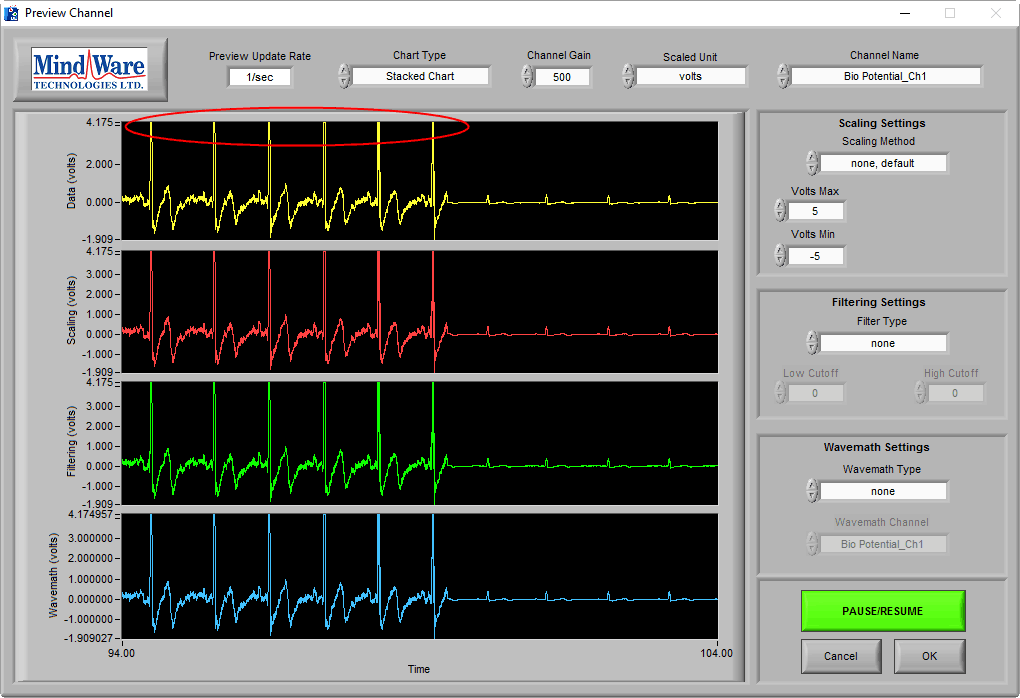
This is a particularly bad issue, as the data which is clipped off is not recoverable and will render the results obtained from it unreliable. If you ever see this, be sure to again check your gain settings and adjust them accordingly so you are recording the full ECG cycle.
Want to learn more?
Check out these other articles on improving data quality:
Don’t see a signal, but want us to cover it? Send us some feedback!