All About Cardiac Impedance
Cardiac impedance is a measurement of the mechanical activation of the heart. By recording cardiac impedance in conjunction with the electrical activation of the heart, the electrocardiogram (ECG), we can gain insight into sympathetic nervous system influence through measures such as Pre-Ejection Period, Stroke Volume, and Cardiac Output. When combined with heart rate variability (HRV) analysis, we can obtain a more clear picture of autonomic balance.
The act of recording cardiac impedance is referred to as impedance cardiography, which is sometimes abbreviated as ZCG or ICG. This blog series will touch briefly on how cardiac impedance is measured, but will focus mostly on interpretation of the signal itself and related signals used in impedance cardiography analysis. We will discuss the algorithms available for identifying key landmarks on the signal, how to visually inspect and correct these key points, and the statistics calculated in the Impedance Analysis application.
First, let’s go over how the cardiac impedance signal is measured.
How it is measured
Electrical impedance is the measure of total opposition to an alternating current (or AC) current flow within a circuit. In the case of cardiac impedance, the circuit is the thoracic cavity, or chest, of the body. By injecting a high frequency, low amplitude, constant current signal into the chest, the signal will naturally take the path of least resistance through the blood. As the heart beats, the volume of blood in the aorta changes, as does the measured impedance to the constant current signal. As blood volume increases, impedance decreases, and vice-versa.
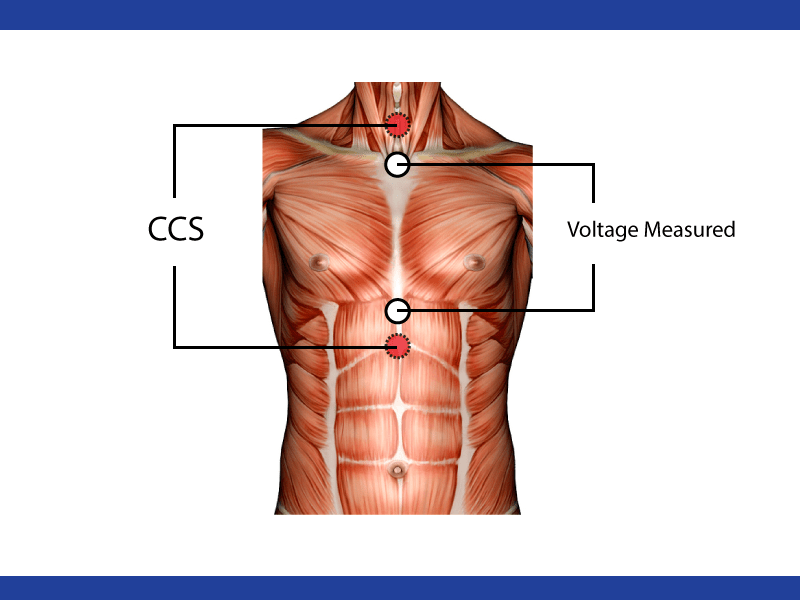
ICG requires 4 electrodes – 2 outside electrodes which supply the constant current source (CCS) and 2 inside electrodes which sense the changes in impedance (SNS). Check out this video for more information on how to apply spot electrodes for ICG, or refer to our Electrode Placement poster.
Spot vs. Band Electrodes
I am not going to attempt to tackle the debate of spot vs. band electrode superiority here, as there are advantages and disadvantages to using both. It is important to note that the measured impedance with bands will be higher than what is obtained with spot electrodes. For this blog post, all example data sets have been collected using spot electrodes.
ICG Signals
Zo
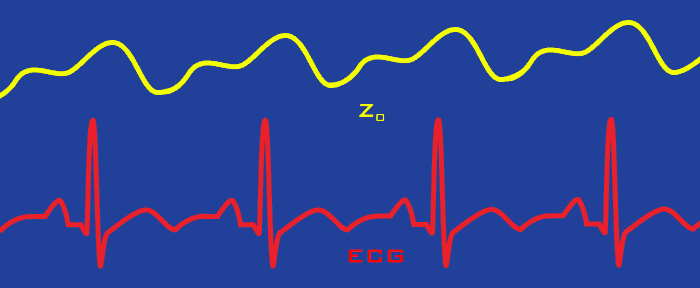
The cardiac impedance signal is typically referred to as Zo (“zee-naught”) or Z0 (pronounced “zee-zero” or “zee-oh”). We will use Zo for consistency moving forward, but it is good to be aware of the various ways the signal is referenced. Since it is a measure of electrical resistance, Zo is measured in Ohms. Below is an example Zo over several cardiac cycles:
dZ/dt
Those of you that remember your calculus will be able to discern the relationship between dZ/dt and Zo. For those that need a refresher – this is the notation for the first derivative of Z, or the change in impedance relative to time. Many instruments perform this derivation in hardware (such as the MindWare desktop and mobile platforms), but it is also possible to mathematically derive the dZ/dt signal in software. Below is a single cycle of dZ/dt:

For impedance analysis, dZ/dt waveform is actually much more telling than the corresponding Zo signal. It is from this waveform that we can identify key landmarks corresponding to the mechanical function of the heart. In fact, the Zo signal isn’t even shown in the Impedance Analysis application, and all editing is done exclusively to the dZ/dt waveform. The dZ/dt waveform will be the focal point of the next few blog posts in this series.
Helpful Hints
- Cardiac impedance is an important indication of sympathetic nervous system activation.
- dZ/dt is the main waveform used to analyze cardiac impedance, as this waveform contains the distinct landmarks which can be tied directly to mechanical functions of the heart.
- Both Zo and dZ/dt have visually recognizable characteristics – learn these and make it a point to preview and identify these characteristics before acquiring data to ensure the quality of the data being collected!
Next time we will focus on the relationship between ECG and dZ/dt, and how that relationship is used to generate an average depiction of the cardiac cycle for a given time segment.