Before reading this article, check out these basic guidelines for ensuring good data collection which are universally applicable. Now we will get a bit more focused, and talk about signal specific data quality issues that can arise and how to deal with them.
Disclaimer: Labeling data “good” or “bad” is somewhat subjective – and many times even “bad” data is still usable, albeit with a significant time commitment in signal editing during analysis. Sometimes, based on the protocol or what actions the subject is performing, certain types of noise are unavoidable. Your data don’t always have to look perfect, and this article simply contains the steps you should take to ensure you are recording the best data possible.
Cardiac Impedance (Z0 and dZ/dt)
Cardiac impedance measurements consist of two signals – Z0 which is the actual impedance waveform, and dZ/dt, which is the inverted, first derivative of Z0. Let’s start with a model of the morphology, or shape, of each of these waveforms:
Z0
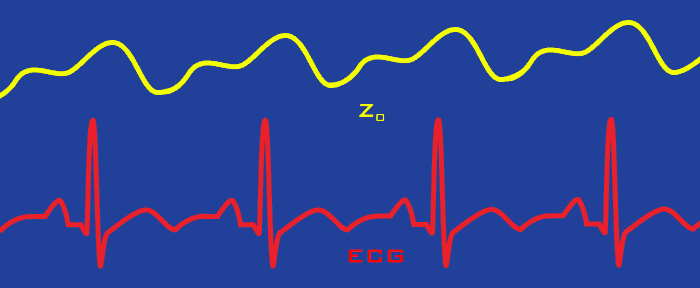
Here we see Z0 in relation to ECG – with each cycle of ECG there is a corresponding cycle of Z0, which depicts the change in blood volume of the heart. There are a couple of important characteristics to understand about Z0:
- Amplitude is an important indicator of good signal quality with Z0. Z0 is measured in Ohms, and a typical average amplitude can be anywhere from 5-35 Ohms when using spot electrodes (or approximately twice that when using bands).
- There is a respiratory component to Z0 which can be observed as low-frequency oscillations as the subject breathes. This is not something to be concerned with (and actually contains useful information), as long as the expected Z0 morphology continues to be visible on top of the respiration wave.
dZ/dt

This is a single cycle of dZ/dt, or the derivative of Z0, which again will be present for every heart beat. The dZ/dt waveform is used extensively for determining time-based statistics in impedance cardiography analysis.
One of the most important features of dZ/dt is the B point “notch” as the signal rises to a Z point peak. The B point will not always be visible depending on a few factors:
- Hardware used to collect/derive the signal
- Electrode placement (reference this video, as well as the electrode placement poster)
- Individual differences in physiology
Having a visible B point is great, however there are algorithms for estimating its location in its absence. Most critically, it is important to recognize that the general shape of this waveform is present.
Note: Another important concept to understand is that Z0 and dZ/dt are different representations of the same measurement – meaning that if one is poor quality, it is likely they both are.
Good Quality Data
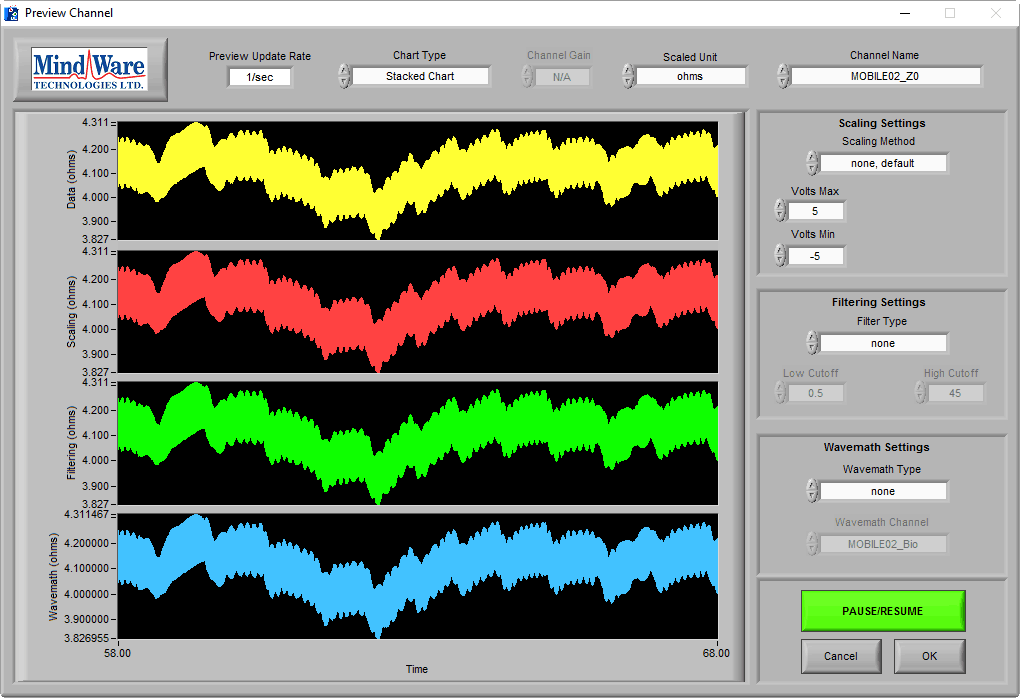
Now let’s look at some data on the BioLab preview screen, starting with Z0:
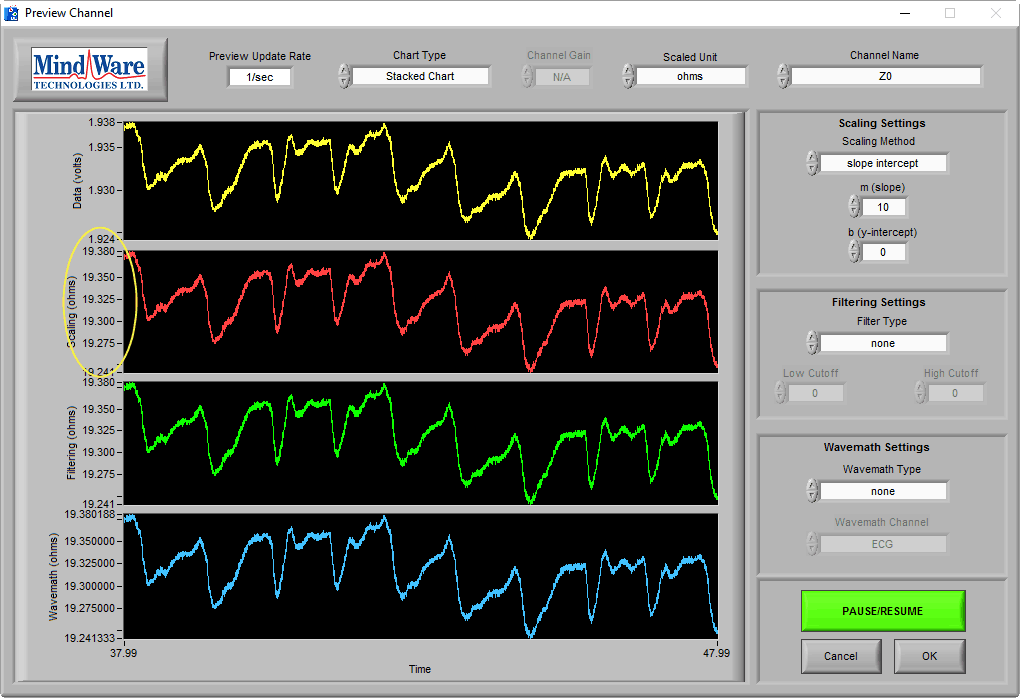
Here we can see cycles of Z0 follow a similar pattern to the artistic rendition, and we can see in the scaled waveform that the average value is in the expected range (see this post for help scaling Z0 to Ohms). As mentioned previously, there is often a respiratory component present in the signal:
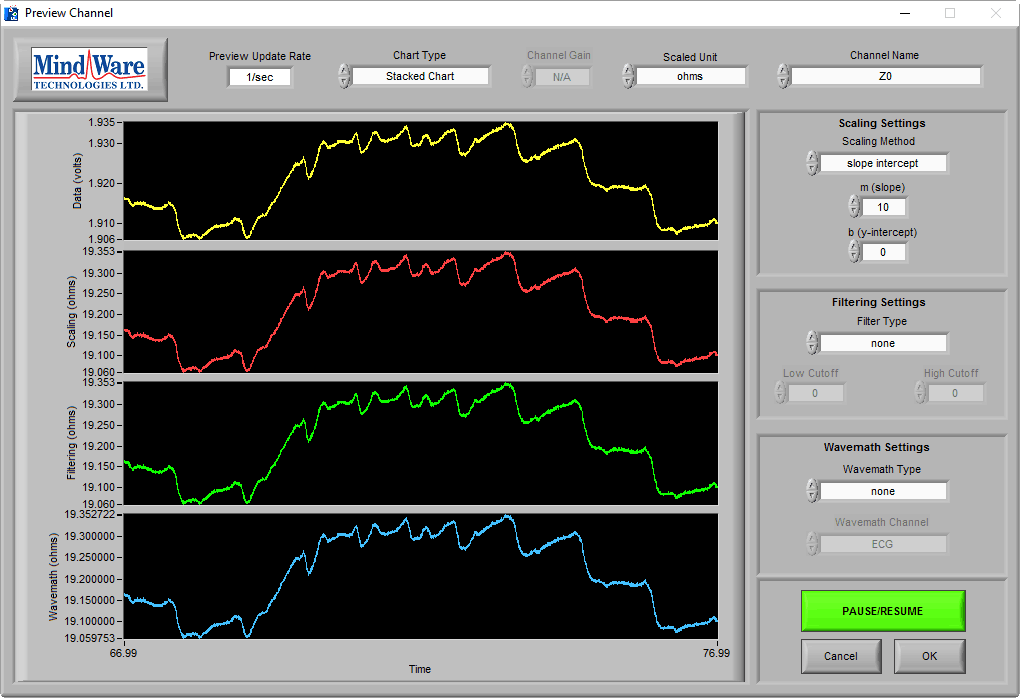
This is to be expected and in this example the respiration is not negatively affecting our ability to see the Z0 cycles, so it is not problematic.
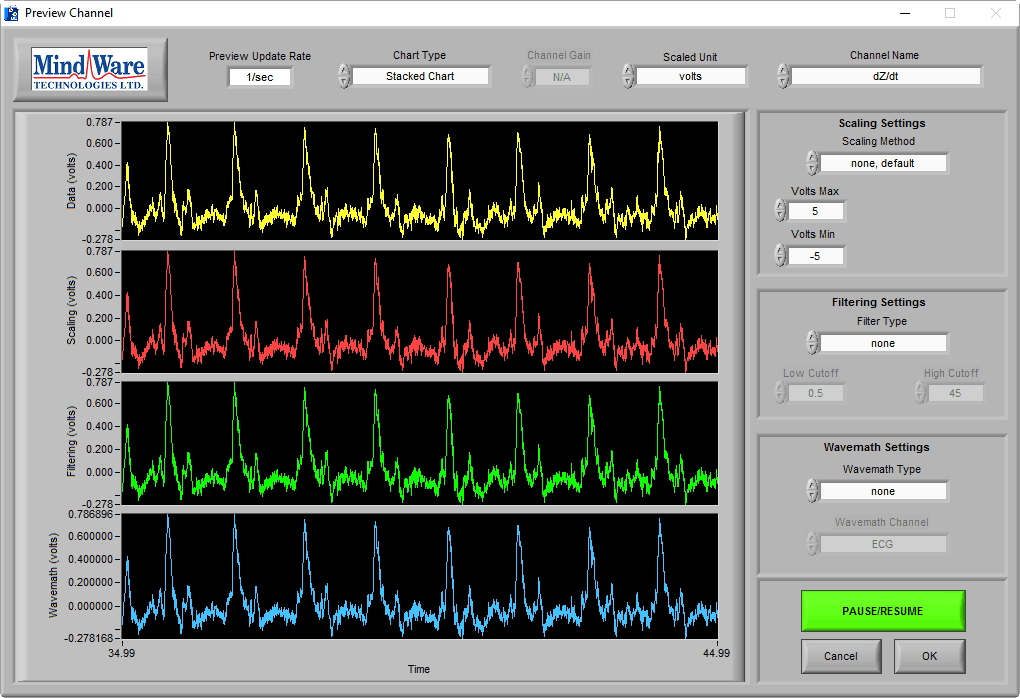
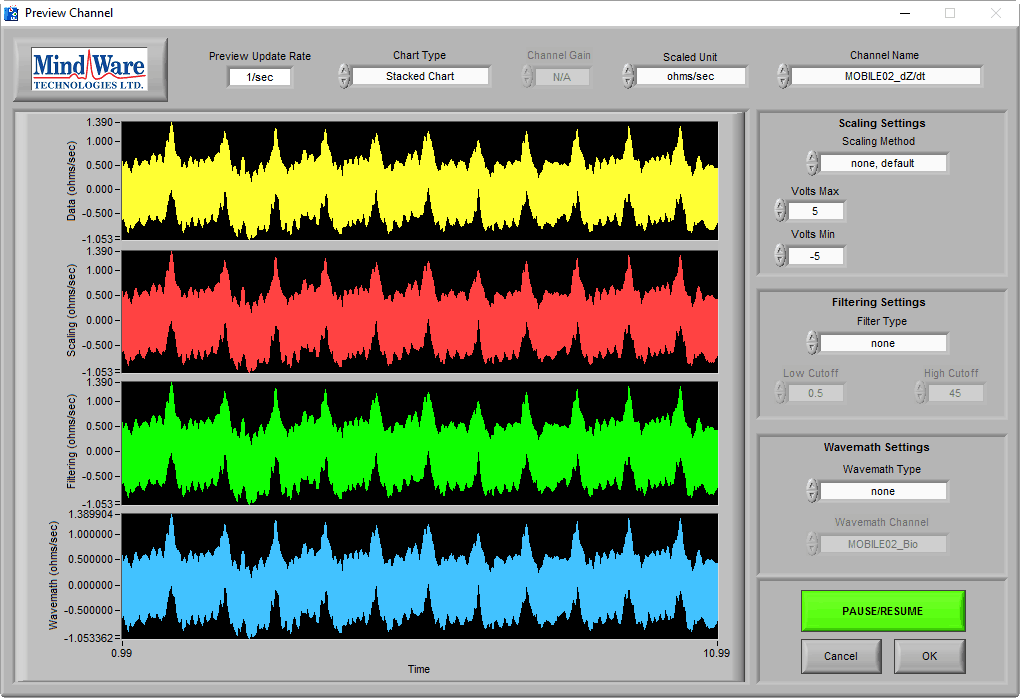
If we switch to the dZ/dt channel:
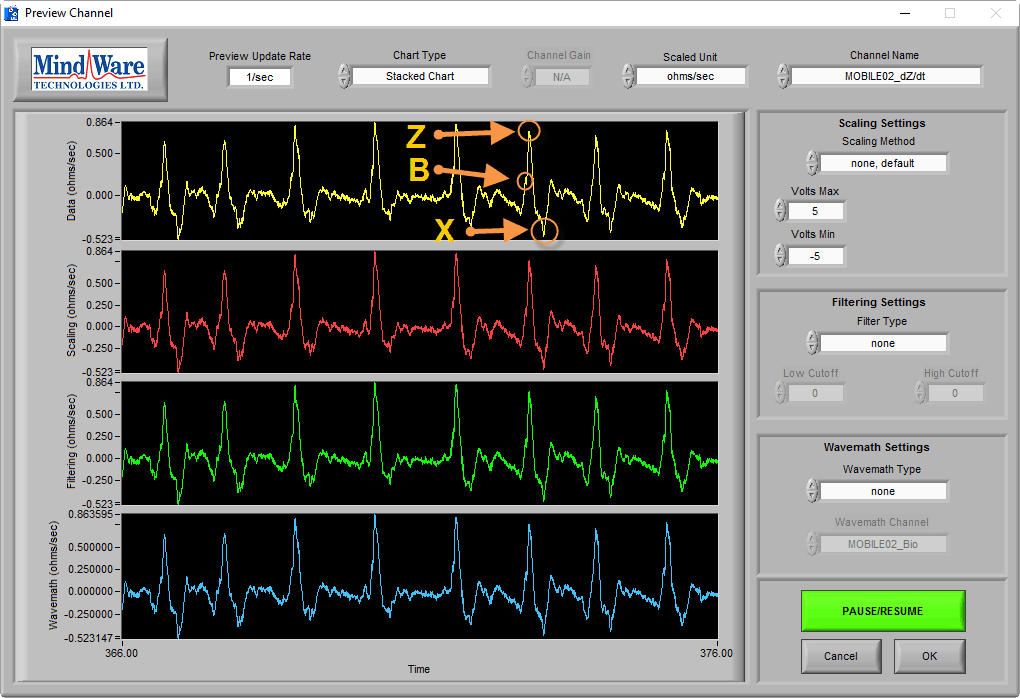
This is some good-looking dZ/dt. Cycles are clearly identifiable, and there is even occasionally a visually identifiable B point. This data was collected using the MW Mobile Impedance Cardiograph.
Data collected with the Impedance Cardiograph & GSC 2 module for the BioNex may appear a bit more noisy:
However, the cycles of dZ/dt are still clearly visible, and the noise will cancel out during analysis through ensemble averaging.
Poor Quality Data
Now let’s look at some common issues when collecting data and how to fix them.
Poor Electrode Contact
If the subject moves slightly and the signal immediately becomes unstable, chances are you have electrode connectivity issues:
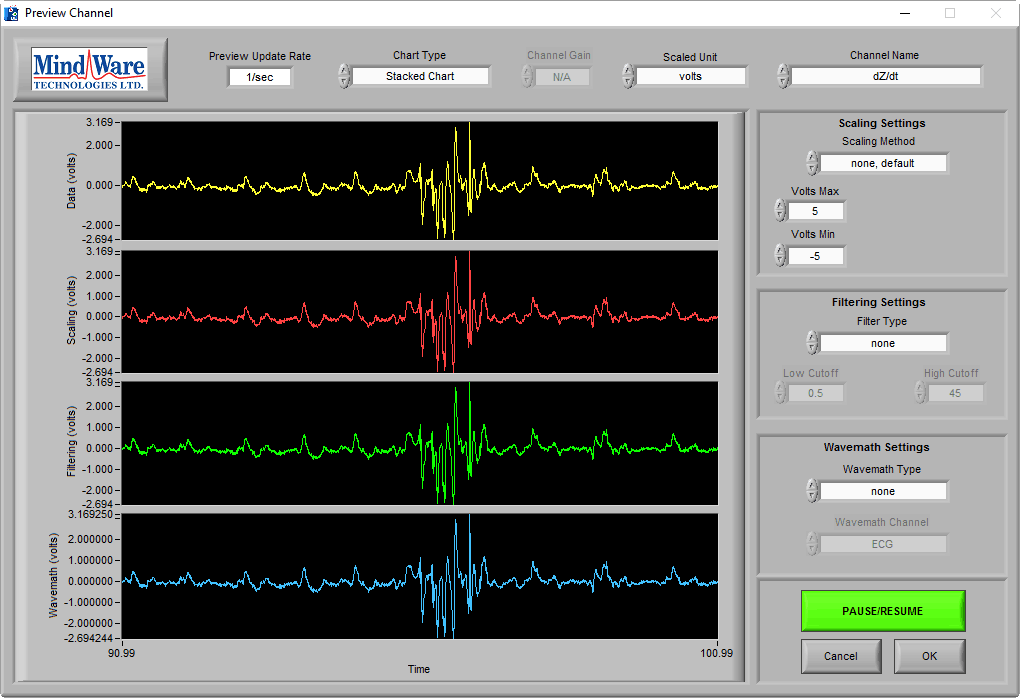
Here we see good dZ/dt cycles, but suddenly the signal becomes erratic and not useful for that moment. There are a few common reasons for this occurring:
- Dry/poorly adhered electrodes
- Unsecured lead wire
- Non-ideal electrode placement
To remedy this, make sure you are always using fresh, wet electrodes, secure the lead wire with tape, and practice proper electrode placement technique. For more on all of these topics, check out this instructional video.
Note: This is one of those cases where some noise, depending on the task being performed, will be unavoidable. Do your best to minimize the effect it has on the data, and the rest can hopefully be dealt with during analysis (see this post on how this is done).
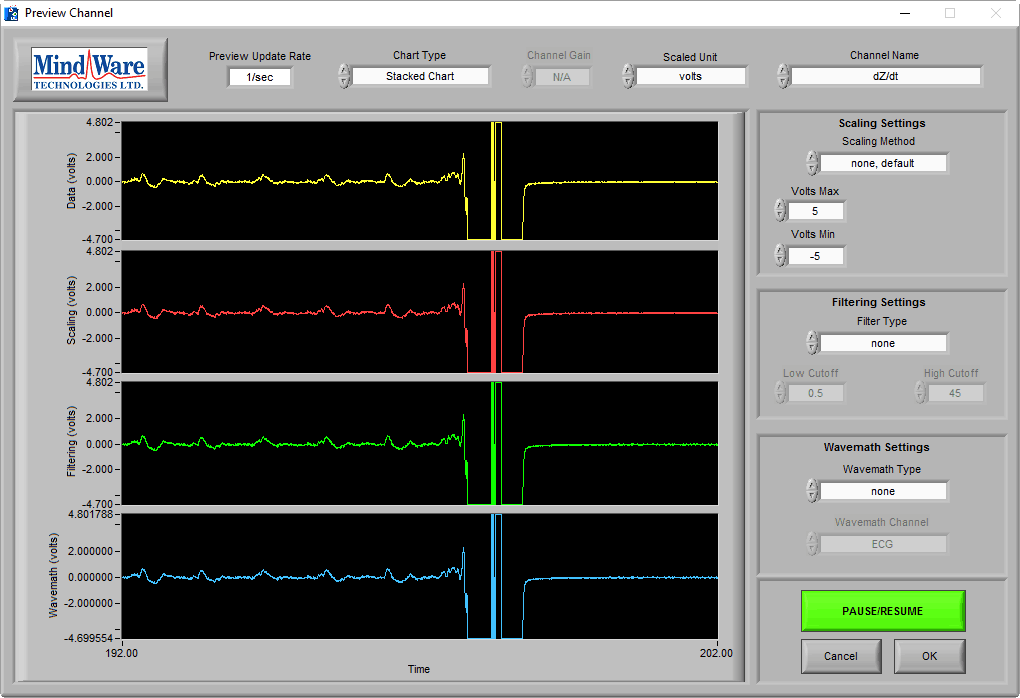
No Signal
it is also important to recognize the absence of signal. This can be the result of an electrode becoming detached, which can look something like this:
Again, when experiencing something like this, be sure to check electrode quality and placement.
100 kHz Noise
The carrier signal for cardiac impedance runs at a frequency of 100 kHz. If your subject, leads, harness, or recording hardware is in close proximity to another source of 100 kHz signal (such as another impedance cardiograph), it is possible that the signal could interfere with the cardiac impedance measurements. It would look something like this in Z0:
and like this in dZ/dt:
It is possible to filter out this interference with a band stop filter at the offending frequency, but it is likely that the interference frequency will vary over time and temperature. It is best to deal with this before data is acquired.
Try to identify the source of the noise, and eliminate it. If it is not impossible to eliminate due to the requirements of the experimental protocol, MindWare can tune the carrier frequency slightly on both BioNex modules and the MW Mobile to minimize the interference. Contact us for more details.
Want to learn more?
Check out these other articles on improving data quality:
Don’t see a signal, but want us to cover it? Send us some feedback!