Before reading this article, check out these basic guidelines for ensuring good data collection which are universally applicable. Now we will get a bit more focused, and talk about signal specific data quality issues that can arise and how to deal with them.
Disclaimer: Labeling data “good” or “bad” is somewhat subjective – and many times even “bad” data is still usable, albeit with a significant time commitment in signal editing during analysis. Sometimes, based on the protocol or what actions the subject is performing, certain types of noise are unavoidable. Your data don’t always have to look perfect, and this article simply contains the steps you should take to ensure you are recording the best data possible.
Electrodermal Activity (EDA, GSC, GSR, etc.)
First, lets become familiar with the ideal morphology, or shape, of the EDA signal:
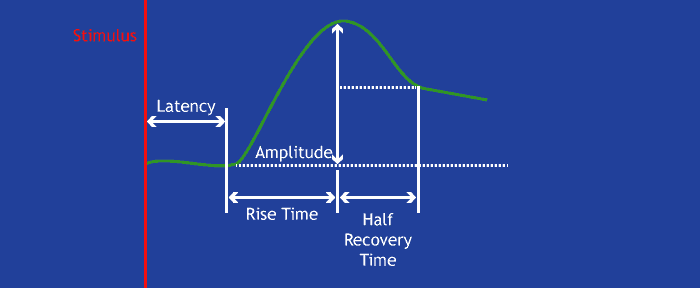
Following some sort of evocative stimulus, there should be a noticeable rise in skin conductance level before it begins to gradually descend back to baseline. This is referred to as a skin conductance response (SCR). It may drift below the half-recovery point (as depicted above), or a new response may begin before that happens.
Amplitude is an important indicator of signal quality with EDA. EDA is measured in microsiemens (µS) and is typically between .5 µS – 45 µS depending a few factors:
- Dryness of skin
- Individual physiological differences
- Electrode site (see electrode placement poster for more info)
Good Quality Data
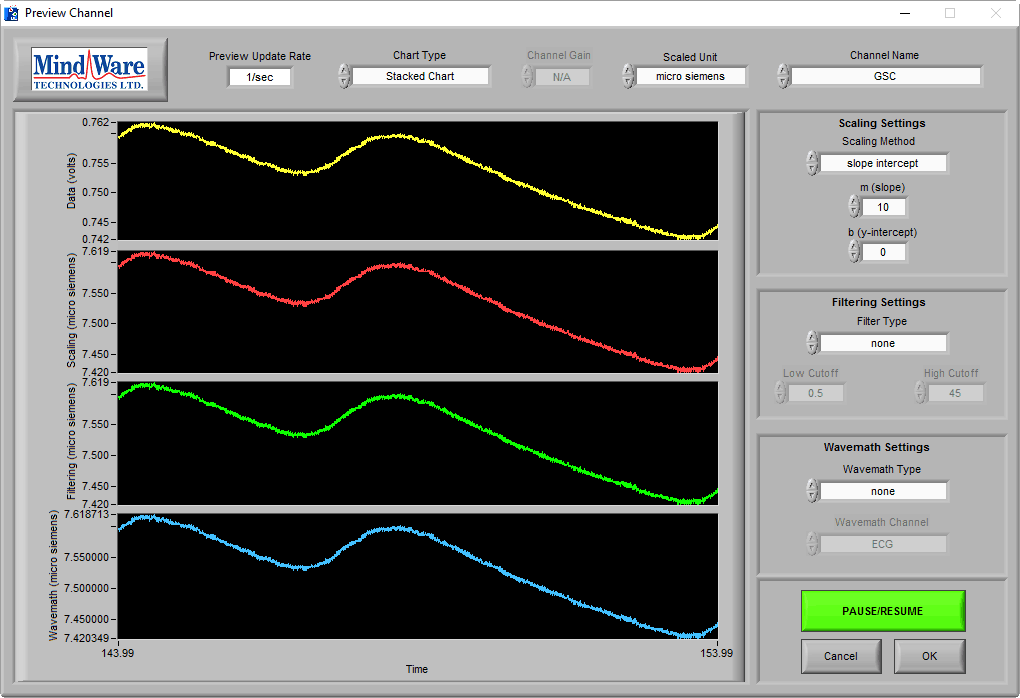
On this BioLab preview screen, we can see a typical skin conductance response:
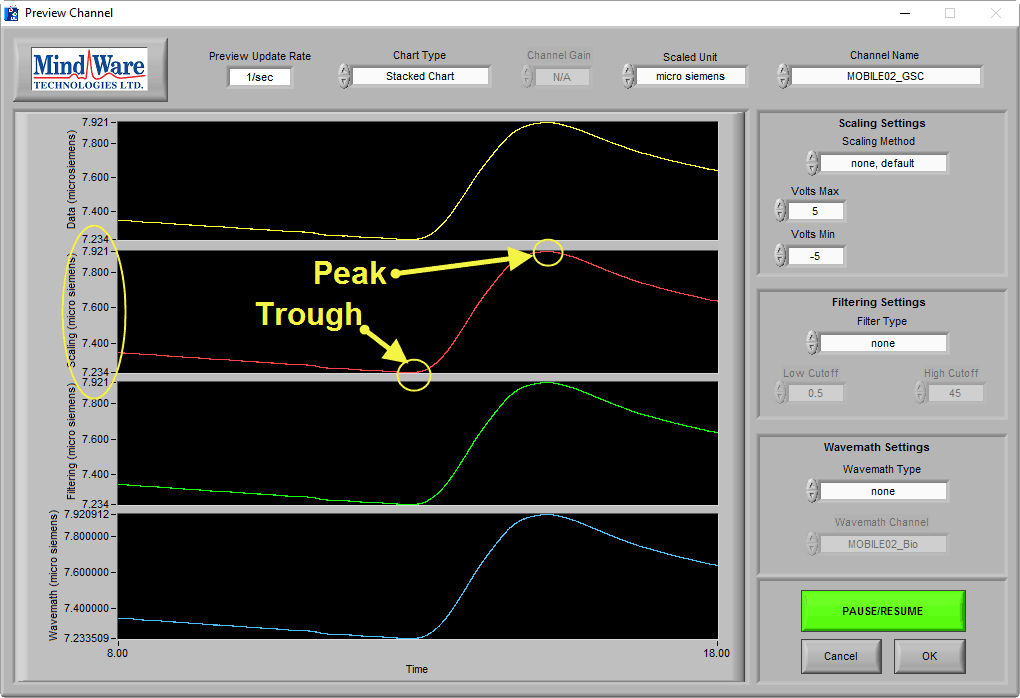
Note: If using a BioNex module to collect EDA, be sure to scale your data to microsiemens to assist in the identification of good quality data
As you can see, the skin conductance increases following arousal, eventually peaks, and begins to return to baseline skin conductance level. We can also see that the signal amplitude is between 7-8 µS, which is well within the normal range of skin conductance. This is a great signal.
Eliciting a Skin Conductance Response
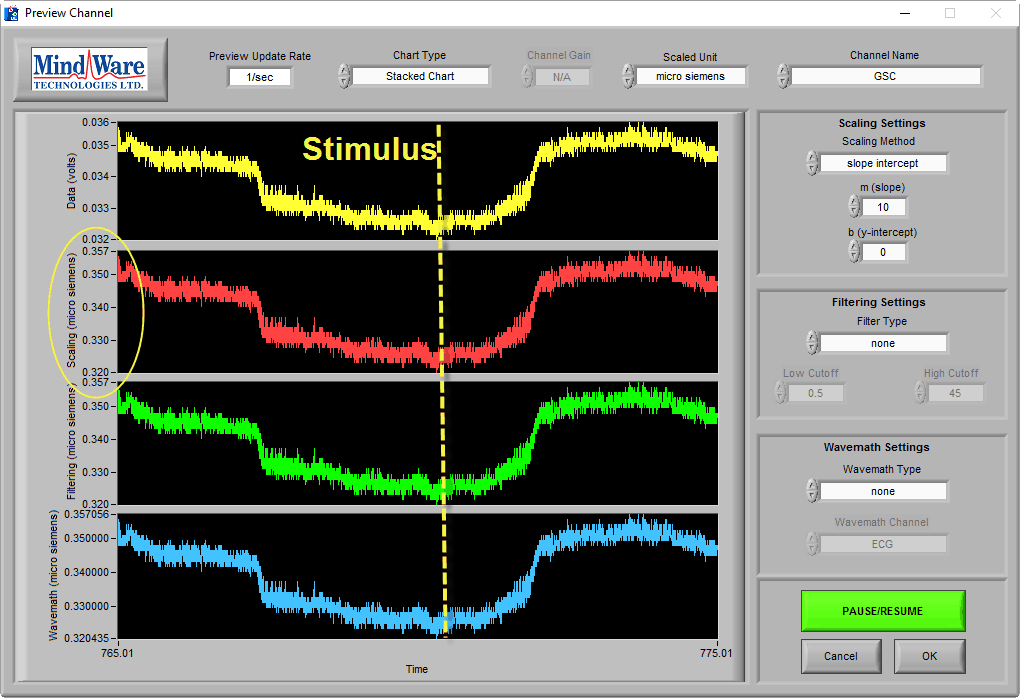
When the subject is not stimulated, there may be no obvious skin conductance response, and the preview may look more like this:
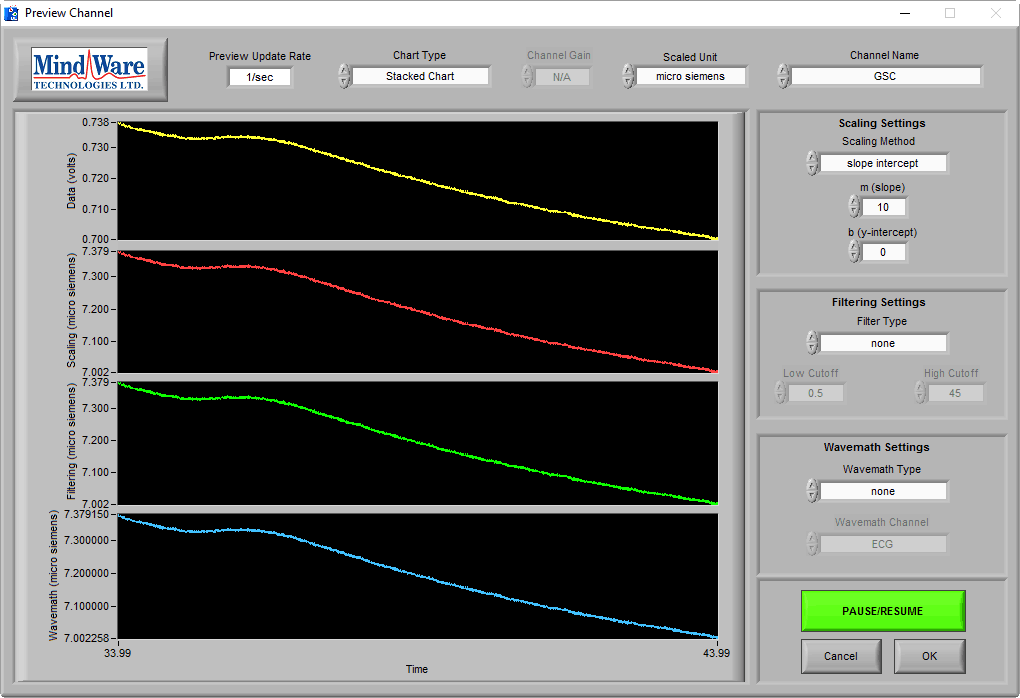
While a trained eye can see that this is still good data, and is in the proper microsiemen range, it is wise to elicit a skin conductance response from the subject to ensure that good data is being collected. This can be done by asking the subject to take a sharp, deep breath through the nose.
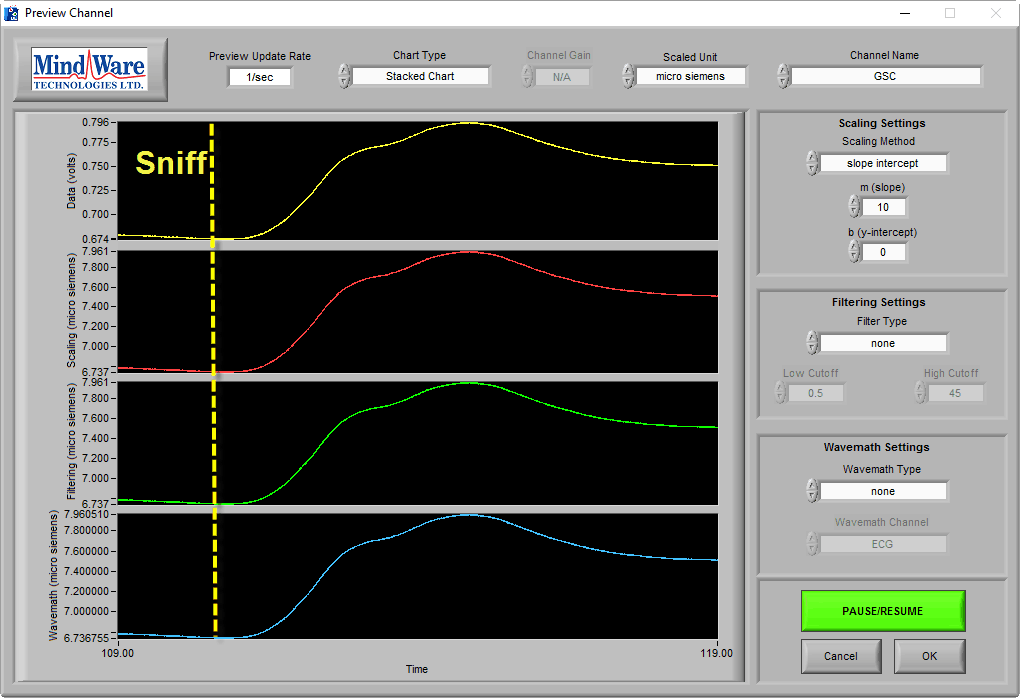
In a normal, properly-hydrated subject, this should always generate a skin conductance response, as evident in the above image.
Poor Quality Data
Now we will look at some common issues that result in poor quality EDA data, and how to identify and fix them.
High Frequency Noise
High frequency noise, usually caused by electrical interference, is a common problem due to the amount of equipment in and around lab spaces today. This noise can manifest in the data as a small amount of fuzz on top of the EDA signal:
Generally, the nature of collecting EDA prevents most sources of electrical interference from becoming an issue, but it can affect the exact placement of peaks or troughs during analysis. Usually no action is needed here, but eliminating the source of the noise can prevent potential issues:
- Are the lead wires or subject harness in contact with any electrical cables? Are they near a computer monitor or other large electronic device?
- Are there electrical cables running under the subject’s feet?
- If using a MW Mobile, is the Mobile plugged in using a non-standard power supply?
- Are there large fluorescent lights in the room? Try turning them off, does the noise go away?
These are far from the only cause of electrical noise, but a place to start. Just do your best to remove as much noise as possible from the raw signal. If there is still noise in the data, you can try applying the EDA filter or a rolling filter to reduce the effect of the high-frequency noise.
No Signal
It is also important to recognize the absence of the EDA signal, which might look something like this:
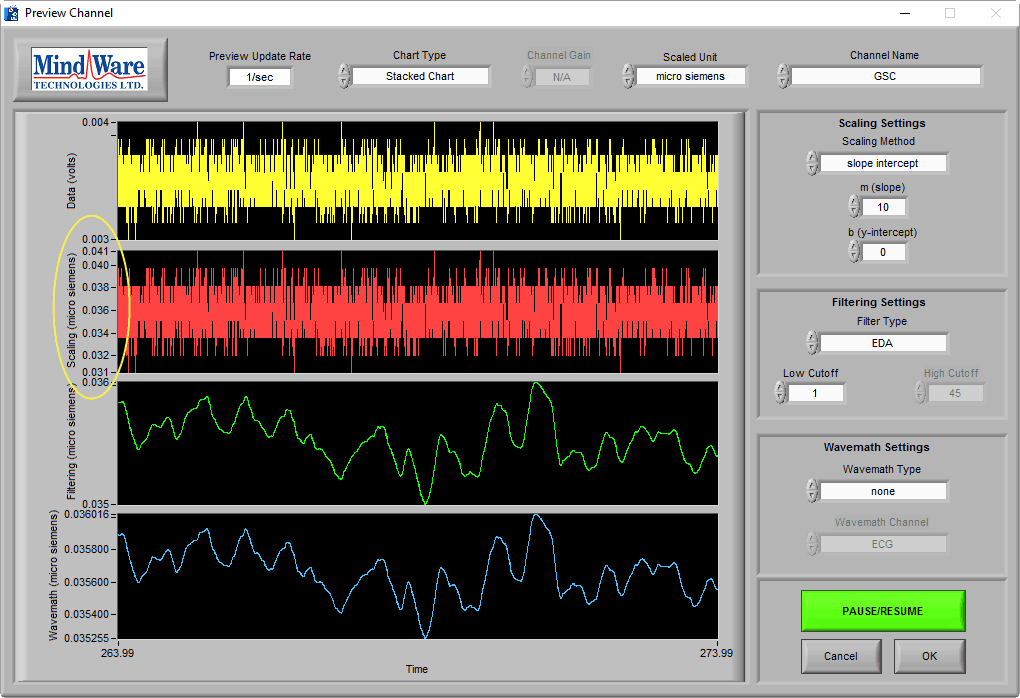
At a time of no stimulus, resting skin conductance could possibly look like this (see One More Point). The key to identifying a lack of signal is the signal amplitude, as well as using the sniff test. This signal is less than 0.1 µS, which is well below any normal physiology.
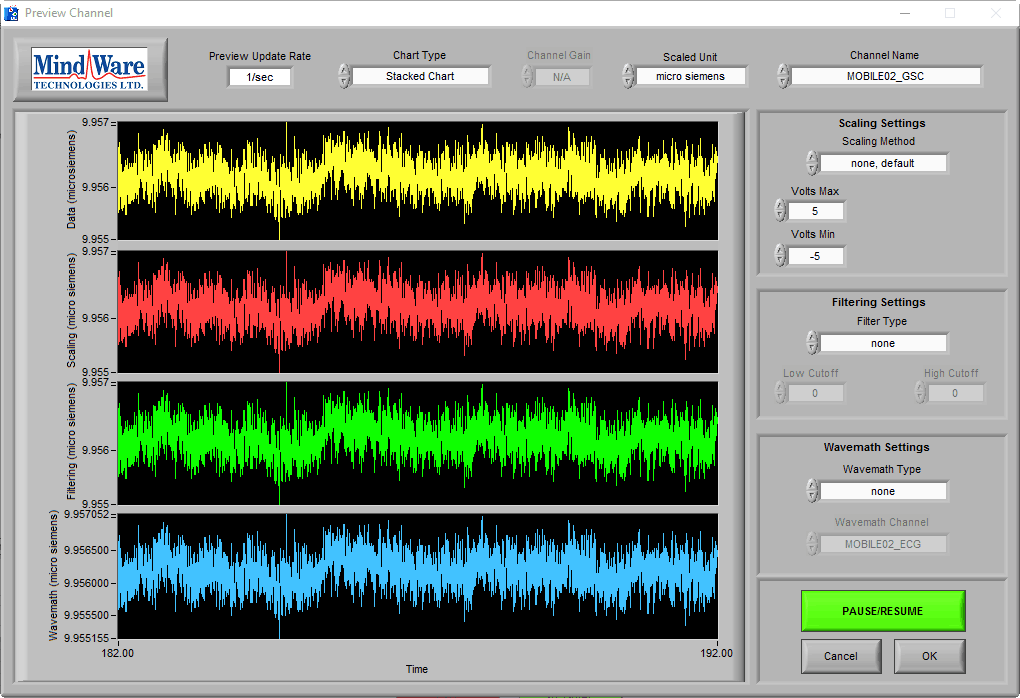
It is especially misleading if you apply an EDA filter and are unaware of the signal amplitude:
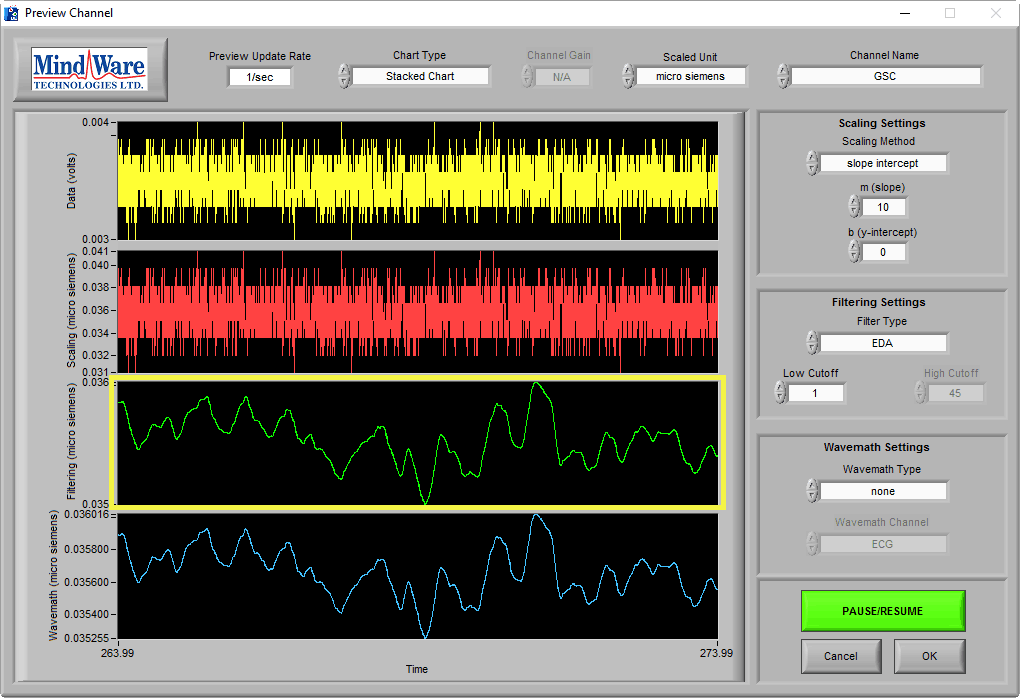
Pay attention to the Y axis when determining EDA signal quality.
Low Amplitude Signal
Signals can show expected skin conductance morphology but at a low amplitude:
This can be indicative of a few potential problems:
- Dry or expired electrodes – follow the instructions in this video to help identify if this is the case
- Using the wrong electrodes – make sure you are using GSC electrodes with the proper gel concentration
- Dry skin – ensure that the subject is washing their hands with soap that is free from fragrance and alcohol and never clean the electrode site with alcohol wipes
- Ensure the electrode site is properly chosen (see this video for more information)
- Incorrect gain/scaling – be sure to set your gain correctly
- Dehydrated subject
One More Point…
With EDA, you are likely to see segments of data where the subject has no measurable change in conductivity and while it is good data, it looks very much like the no-signal or low-amplitude signal cases:
The amplitude of this signal differentiates this from the others and the sniff test can prove that good data is being recorded.
Want to learn more?
Check out these other articles on improving data quality:
Don’t see a signal, but want us to cover it? Send us some feedback!