“So… what does the Rolling Filter do?” If I had a dollar for every time I’ve been asked that, I would have a lot of money. Unfortunately I don’t have all of that money, but what I do have is the sense that the Rolling Filter needs a bit more explanation as to:
- What is a rolling filter?
- How/when is it used?
- What should the block size be set to?
This post aims to clear the air once and for all on these questions. Without further adieu…
What is a rolling filter?
A rolling filter is, most simply, a smoothing filter. It is known by a few different names in the world of statistics/signal processing:
- Moving Average
- Running Average
- Rolling Average
All of these terms refer to the same type of operation. In the MindWare analysis applications (specifically EDA and EMG) we refer to it as a “rolling filter”. It has a single parameter labeled “Block Size”, which is defined in samples, or points, on the signal.
Starting at the beginning of the input signal, the rolling filter takes a certain number of points (equal to the block size) and computes an average of these points, producing a single point for the output signal. It then increments to the next point on the input signal, performs this operation again, and continues to do so until it reaches the end of the input signal. Mathematically this can be represented by the following equation:
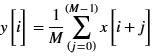
where
y = the resulting output signal
x = the input signal
M = the number of points to average (known as the “block size”)
How/when is the rolling filter used?
The rolling filter is available in the Electrodermal Activity (EDA) and Electromyography (EMG) analysis applications. It is used in both of these applications to smooth the signal and prevent falsely identifying noise as a key point within a segment. We will demonstrate the rolling filter using the application in which it is most commonly used – EDA.
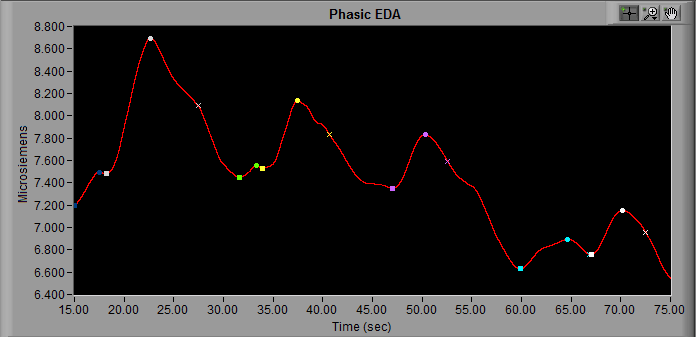
In EDA, it can be used to remove unwanted phasic components of the signal which are resulting in Skin Conductance Responses (SCR’s) being marked where you don’t want them to be. Take for example the following segment of EDA which does not have a rolling filter applied:
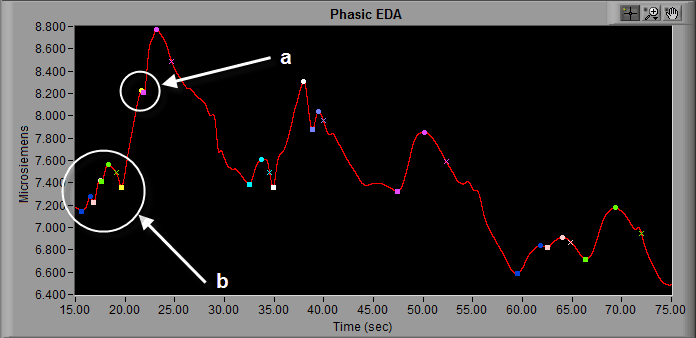
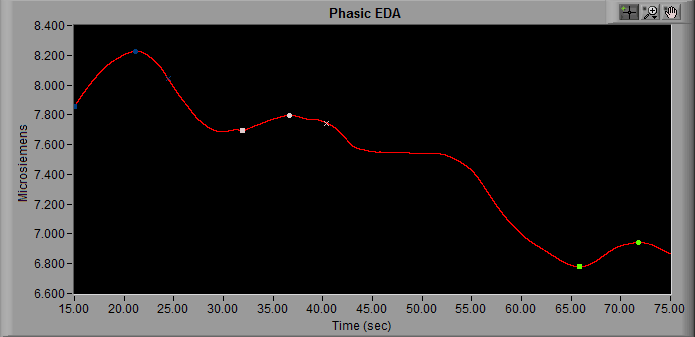
At the point labeled “a“, we see a bit of high frequency noise which is resulting in the EDA application marking two separate SCR’s instead of a single large SCR. Also, in the beginning of this segment (notated “b“), there is a lot of higher-frequency content which results in many SCR’s being identified in a short period of time. While these fluctuations in signal do meet the amplitude requirements for an SCR, it is more likely caused by signal noise than actual skin conductance fluctuations. By applying a rolling filter with a block size of 500 (more on this in the next section) we can see that the signal in these two areas appears significantly smoother, and the SCR’s are more what we would expect to see:
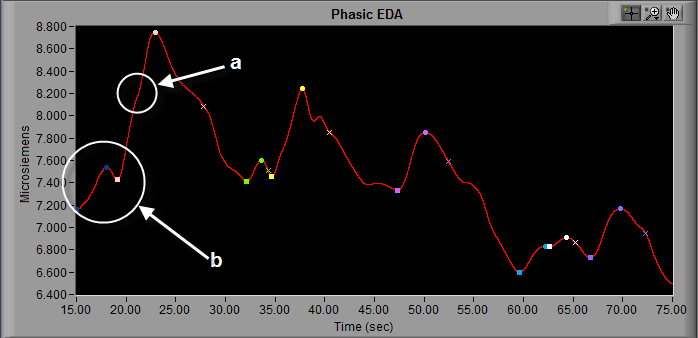
The SCR markings in section “a” have been completely removed, resulting in a single large response as opposed to the two smaller responses seen previously.
How to set the Block Size
As mentioned earlier, the block size is the number of points used when calculating the average, which ultimately is represented as a single point on the output signal. The higher the block size, the more points are used when averaging, and the more drastic the effect on the resulting signal will be. A good starting point is to set the block size equal to the sample rate of the data being analyzed.
Lets take the EDA data we used in our previous example:
A block size of 500 was used, and this data was sampled at 500 samples/second. That means that an entire second of data is being used to calculate the average for each point in the resulting waveform. What would happen if we doubled that?
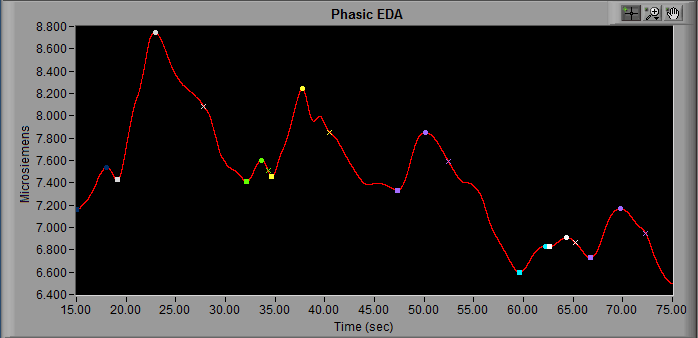
Now we are using the average value of 2 seconds of input data to determine each point on the resulting waveform. We start to see even more rounding of peaks/troughs, and more pronounced changes in amplitude and timing. Twice the sampling frequency is the maximum block size you should consider using in most cases.
If we were to take it to an extreme, with a block size of 5000 points:
We now have a resulting signal which barely even resembles the input EDA signal. The rolling filter has the ability to completely change the morphology of the waveform if misused. Even at lower values, the rolling filter will cause some amount of phase shift in the data and therefore should be applied equally to all subjects in a study. Ultimately, you should only increase the block size to the necessary amount to remove unwanted signal content.
Now that you understand the rolling filter is doing to the signal, use it to make your data analysis easier, but don’t abuse it!