Now that we recognize the components of the EDA waveform, it is important to differentiate between actual response and fluctuations in the signal which are in fact artifacts. It is important to prevent artifact from occurring as much as possible by using quality electrodes and following best practices for data acquisition, but despite our best efforts, there will most likely be a need for data editing. Before jumping into signal editing techniques, let’s take a look at a filtering option which can greatly reduce the editing effort in some instances.
Note: The techniques discussed in this post, while valid in some situations, have not been thoroughly explored and publications detailing their effects are limited or don’t exist. Many investigators opt to not edit the EDA signal beyond applying a smoothing (rolling) filter and discarding segments which do not appear reliable. Use the techniques described below at your own discretion.
Using the Rolling Filter to Minimize Editing
Often times, signal editing entails removing low-amplitude, high-frequency phasic content due to movement or signal noise. As we learned previously, the EDA response is quite slow as far as physiological responses go, making it a good candidate for applying a moving average filter, or rolling filter (described in detail here). Take for instance the following segment of EDA, where multiple high-frequency, low amplitude SCRs are being identified
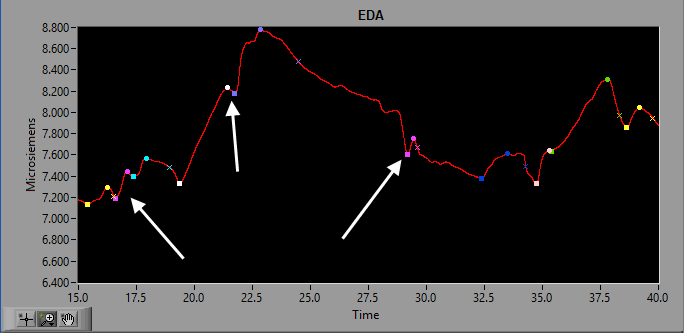
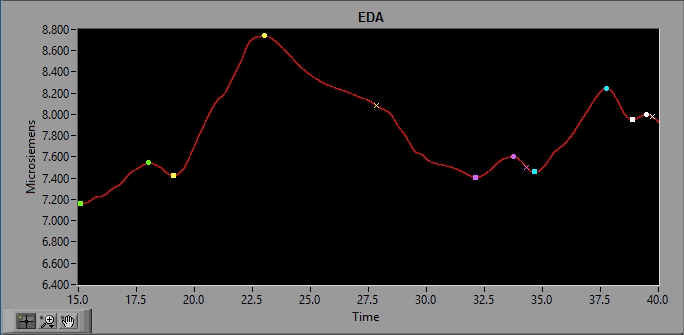
As we will see shortly, editing these SCRs will take quite a few mouse clicks and some careful consideration. If we simply apply a rolling filter with a block size equal to the sampling rate of the signal (in this case 500 samples per second), these unwanted SCRs disappear. This greatly reduces (or eliminates altogether) the need for data editing in some cases.
A word of warning
As the previously linked article discusses, it is possible to overuse the rolling filter, resulting in significant distortion of the data. Be sure to:
- Never use a rolling filter where the block size exceeds twice the sample rate of the signal. Setting it equal to the sample rate is a good starting point.
- Apply a consistent rolling filter to all epochs/subjects/etc. for which you intend to run comparison studies. A consequence of performing a rolling average is a slight phase shift, which is more pronounced the higher the block size is set. By applying a consistent rolling filter, the phase shift becomes consistent, and results will not be skewed.
Identifying Types of Artifact
There are two main sources of artifact in EDA (other than artifact due to data collection techniques): subject movement and respiration.
Subject Movement
When the subject moves, the leads may also move or the electrodes will lose connectivity with the skin momentarily, resulting in sharp increases/decreases in skin conductance which are not physiologically plausible.
Subject motion can also be observed in the higher-frequency, lower-amplitude fluctuations typically removed by the rolling filter, but be careful not to confuse subject movement with compounding skin conductance responses, or responses which occur before a previous response could completely return to baseline SCL.
Note: It can be very helpful to have synchronous video recording from the session to confirm that the shift in skin conductance is truly related to subject movement.
Respiration
Respiration and EDA are known to influence one another physiologically, and irregular/deep breathing patterns can elicit fluctuations in skin conductance which look identical to sympathetic nervous system-driven responses. This makes SCRs resulting from respiration very difficult to programmatically isolate from other more meaningful SCRs. For this reason, the respiration signal is shown alongside the EDA waveform so that it can be monitored for periods of abnormal morphology.
Take for instance the following segment of data:
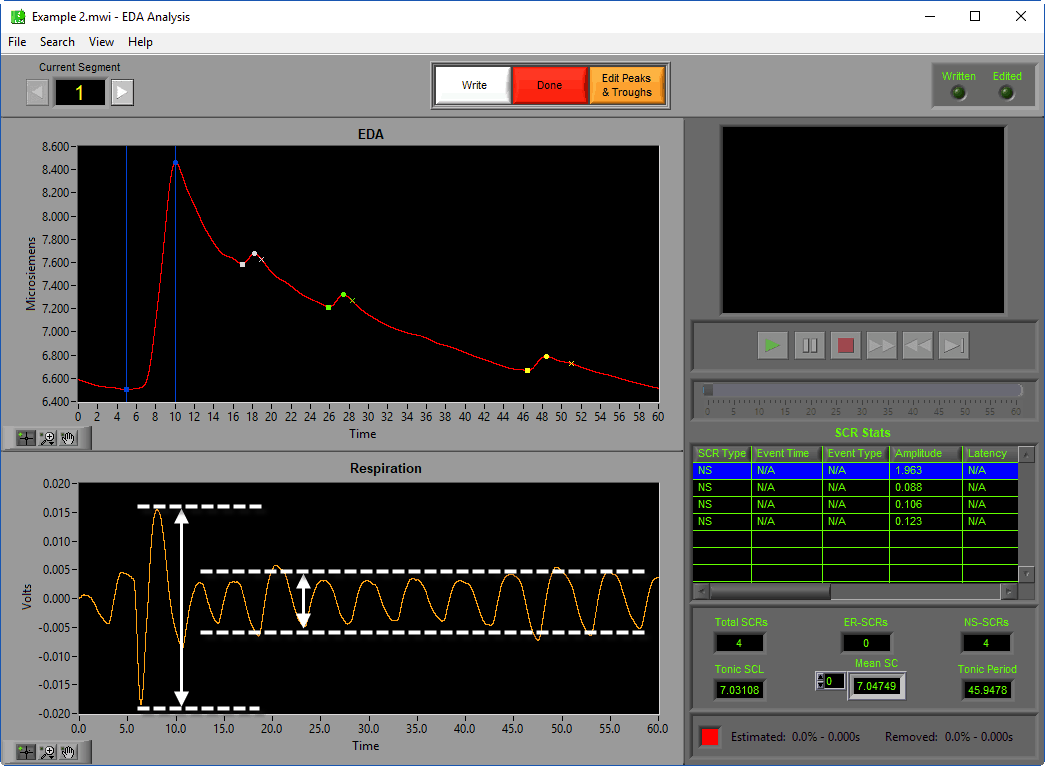
The respiration signal contains a significantly deeper breath in the beginning of the segment, which is soon followed by an SCR. If you have ever used the sniff test to elicit a skin conductance during data acquisition, you will know that the change in EDA lags slightly behind the change in respiration. Here, we see the same lag between the start of inhalation and the start of the SCR. Even if this SCR is event-related (i.e. following a known stimulus), it can be argued that its components have been altered (if not entirely caused by) the change in respiration. In this particular case, the effects of the breath can be seen throughout the remainder of the segment, as evident by the slow return of skin conductance level to baseline. If skin conductance level is of interest, this segment should probably be discarded.
Using the Signal Editor
To deal with either type of artifact, launch the Signal Editor by pressing the Edit Peaks and Troughs button.
![]()
Once the editor has been launched, there are a couple of different tools which can assist in removing artifact depending on the type of artifact identified.
Point Editing
The Point Editing tools can be used to remove the peaks/troughs from an SCR, thus removing it from the statistical output of the application, or to insert a new trough/peak pair for a new SCR. Removing individual points is particularly useful if you are primarily concerned with studying the phasic components of EDA.
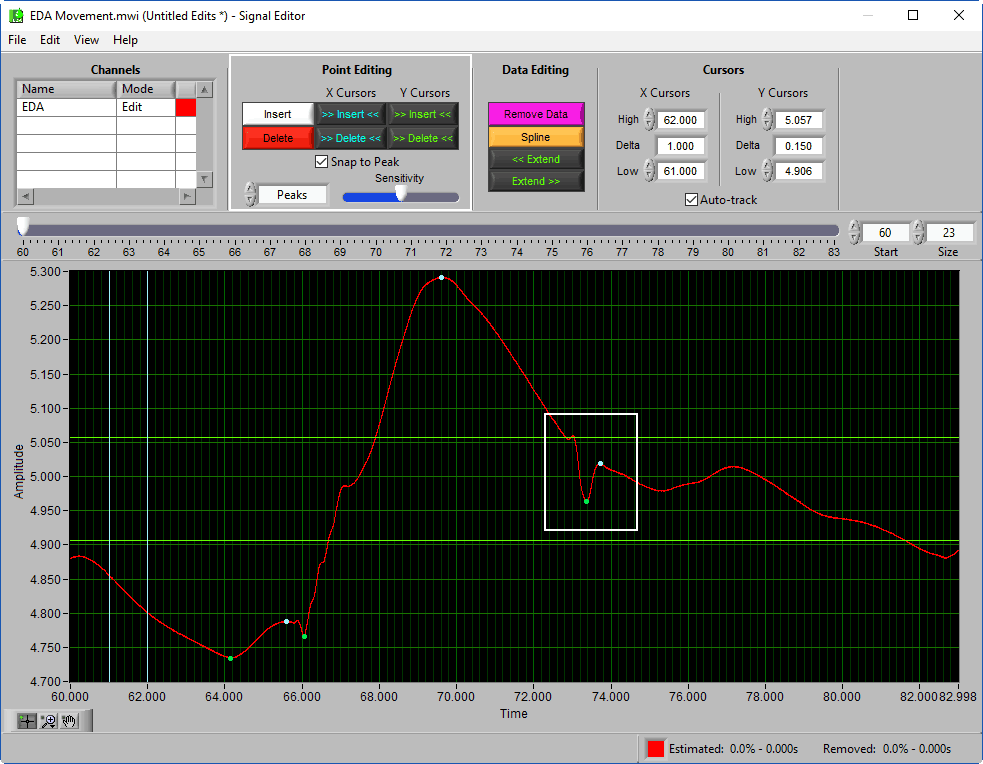
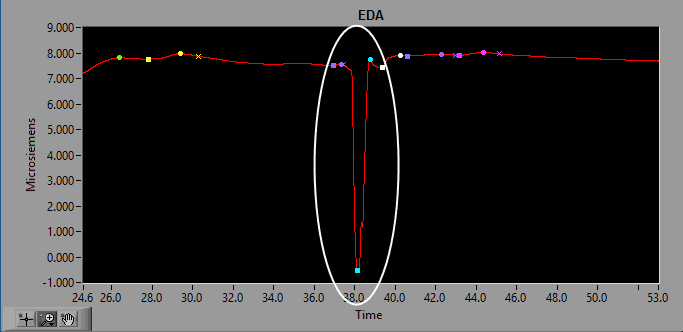
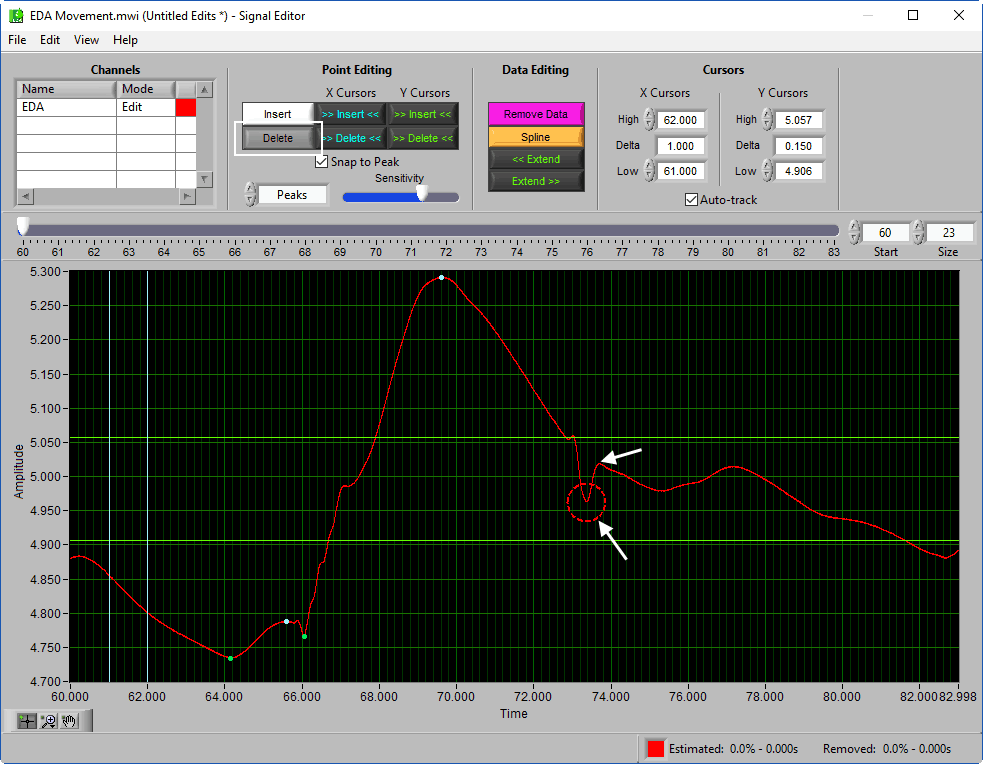
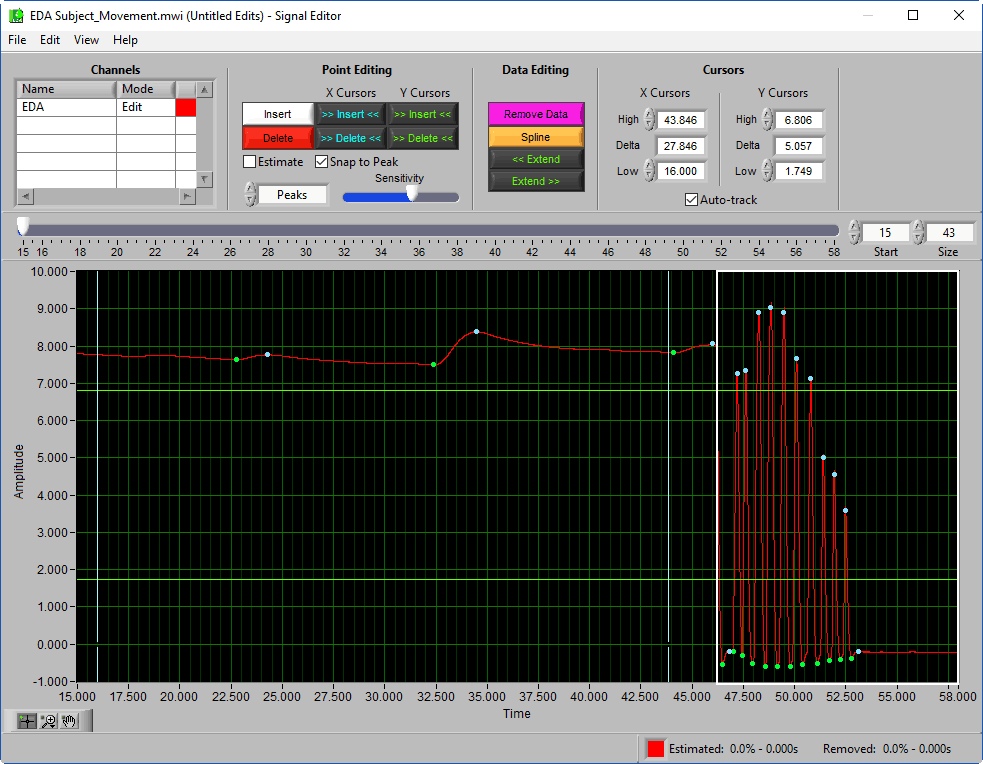
Here we see a sharp downward response in the signal which is not typical of EDA. This is most likely caused by subject movement. To fix this, you could:
- Use the Delete tool to individually delete the peak and trough
- Use Delete All between the X cursors to delete the entire SCR at once.
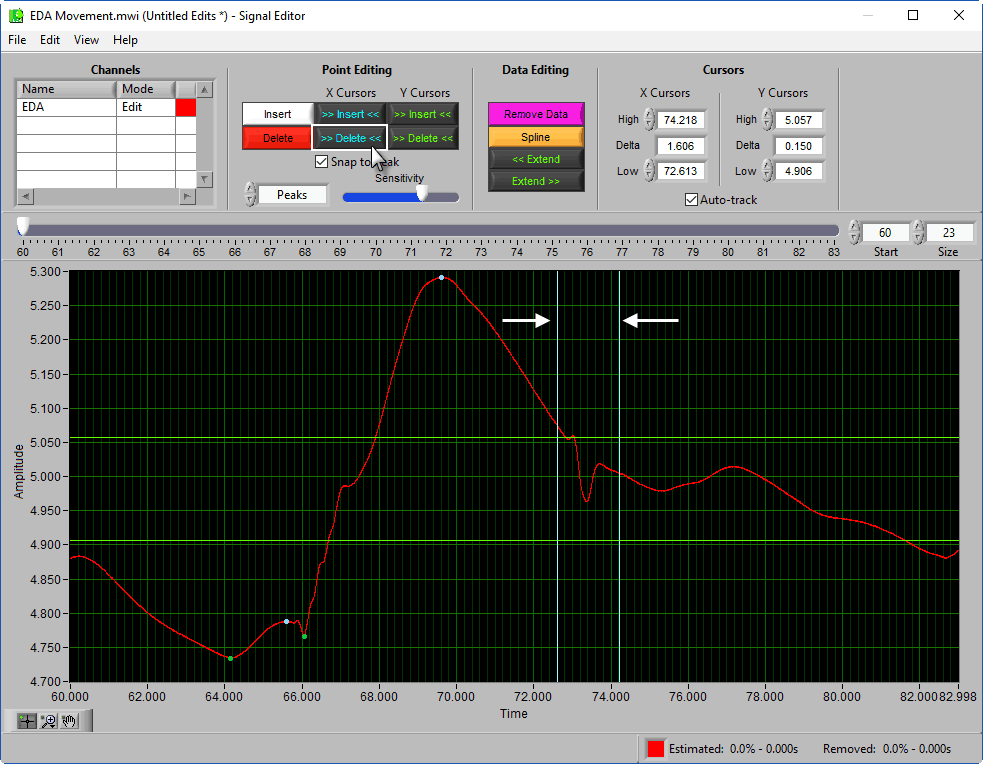
Note: Remember to always remove points in pairs of one trough and one peak. Deleting one or the other can lead to undesirable results.
Data Editing
It is also possible to edit the waveform itself, as opposed to the annotations on the waveform, by using the Data Editing tools.
Note: To reiterate what was stated at the top of this post, research regarding estimating skin conductance data is limited. Estimating short portions of the signal should minimally affect statistics, but when in doubt it may be more appropriate to drop a segment than over-estimate.
Let’s use an example of poor electrode contact. Here, the drop in SCL is far too great and sharp to be physiologically possible.
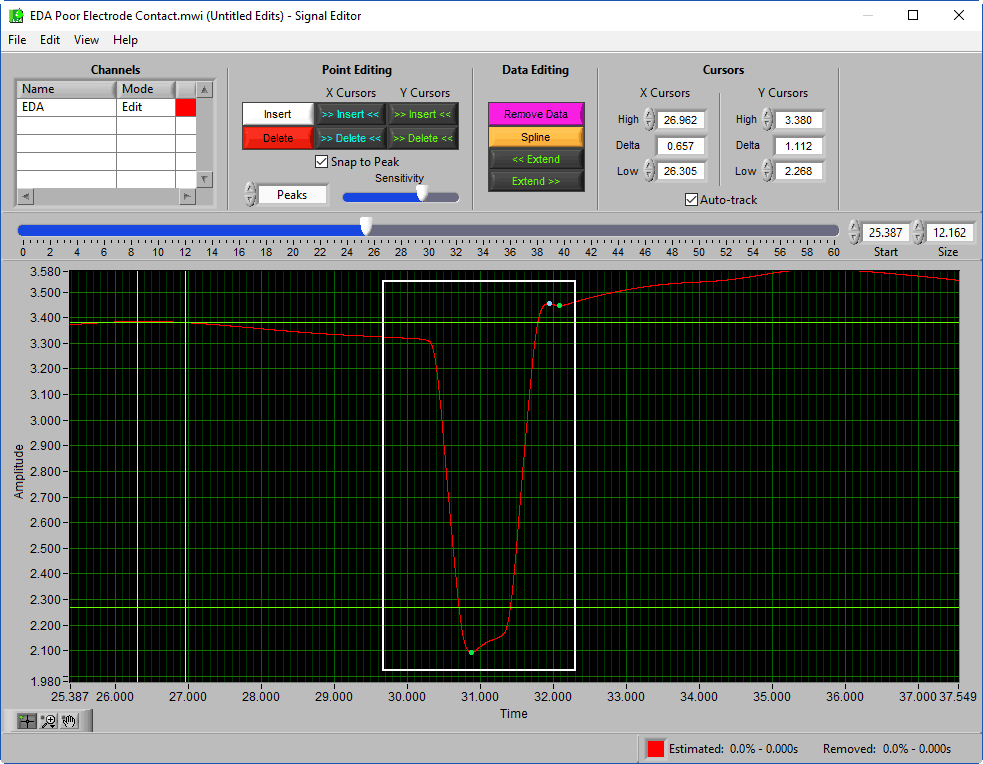
Say you are actually more interested in average SCL for the segment or Tonic skin conductance level. If we simply remove the points, the decreased amplitude as a result of the artifact will still bleed into the amplitude-based statistics. To fix this, we need to estimate the morphology of the waveform as if the artifact had never occurred. To do this, place the X cursors at the start and end of the artifact and press Spline.
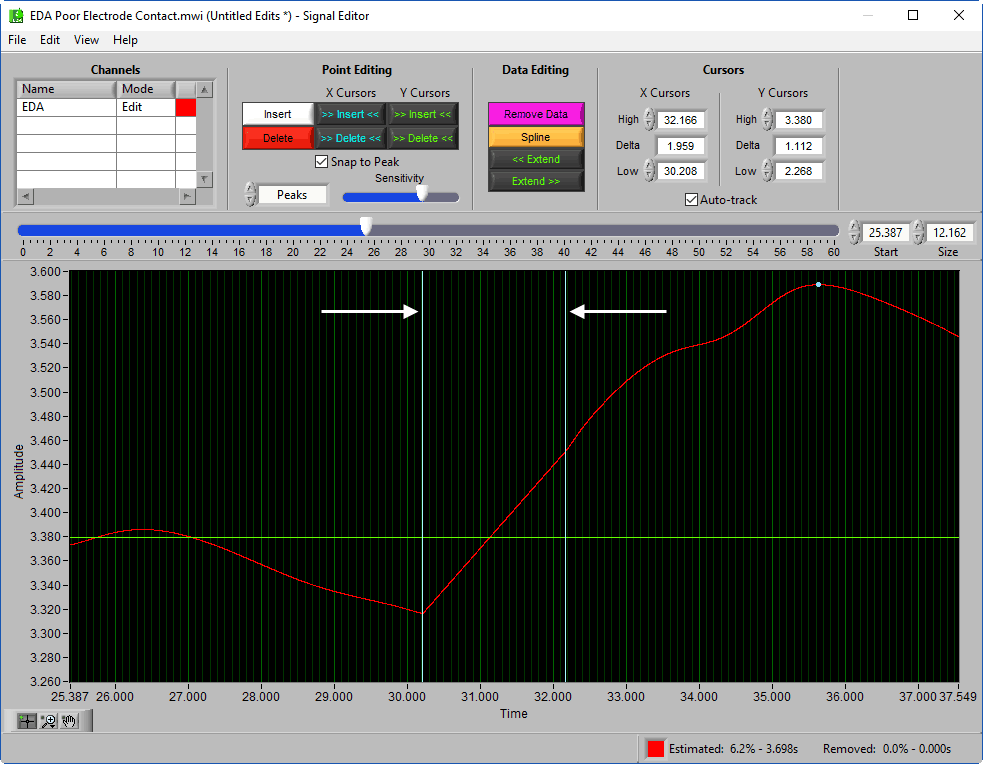
This will perform a spline interpolation of the signal, preserving the general amplitude of the signal while removing the unwanted phasic component.
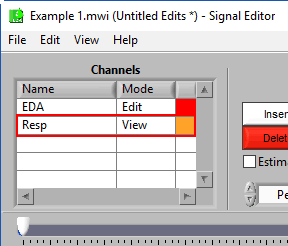
It is considered best practice to only affect the EDA signal when using the spline tool so that the respiration signal is still intact. This is done by changing the Mode of the respiration channel to View before splining.
Using the Extend tool
Occasionally, artifact occurs at the beginning or end of a segment.
The Spline tool requires a beginning and end point to estimate the signal, so it cannot be used in these cases where the noise presumably starts/ends in an adjacent segment. Instead, we can use the Extend tool which takes the amplitude at the X cursor and extends that amplitude to either end of the segment.

Helpful Hints
- SCRs caused or affected by respiration can be difficult to identify due to how similar they appear to actual arousal-based responses. They will be impossible to distinguish without collecting respiration (or cardiac impedance), so consider that when planning data collection.
- It is always ideal to preserve the respiratory waveform when editing so that decisions informed by it can be obvious to future users of your edit file. Make sure to change the channel mode to View to do so.
- Editing can be time-consuming, so be sure to practice good data collection procedures to minimize how much you have to do.
Throughout the last three articles, we have gone over the origins of EDA, components of the EDA signal and what they mean, and how to correct for artifact in the signal. You should now be ready to effectively analyze the EDA signal and produce quality results using the EDA analysis application.
Want to try your hand at data editing? Download the EDA Analysis 3.2 software for a fully functioning demo!