Last time we talked about the significance of measuring electrodermal activity, and how it is collected. Now we can start looking at the resulting waveform and how to extract meaningful information from it.
Scaling EDA to Microsiemens
MindWare applications expect incoming data to be in volts (with the exception being data collected with a MindWare Mobile Impedance Cardiograph, or if the data is already scaled by a 3rd party data collection system). The first step in extracting meaningful information from the EDA signal is to scale it to the expected units of microsiemens (uS). This is done by adjusting the uS/volt setting on the EDA Calibration Settings tab in the analysis application.

Note: If you are analyzing MindWare Mobile files, the EDA channel will automatically be scaled to microsiemens. In this case, the uS/volt setting will be disabled.
Phasic vs. Tonic Skin Conductance
Phasic Skin Conductance (SCRs)
Let’s bring back our diagram of the EDA signal from last time:
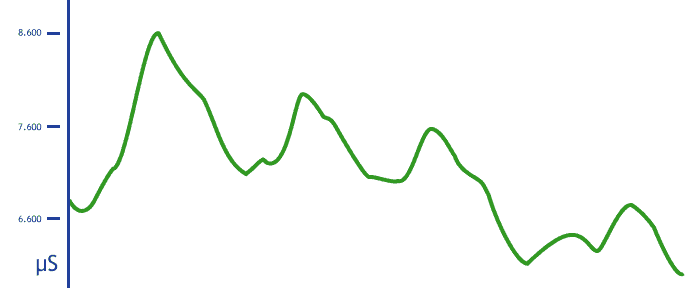
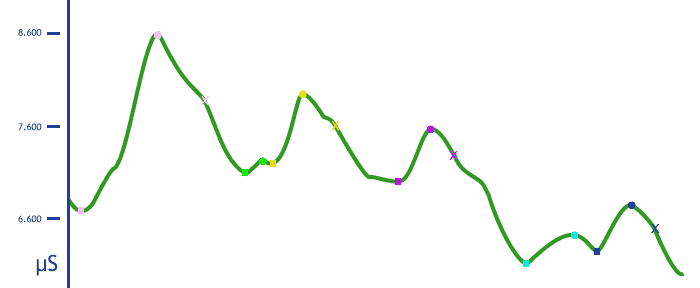
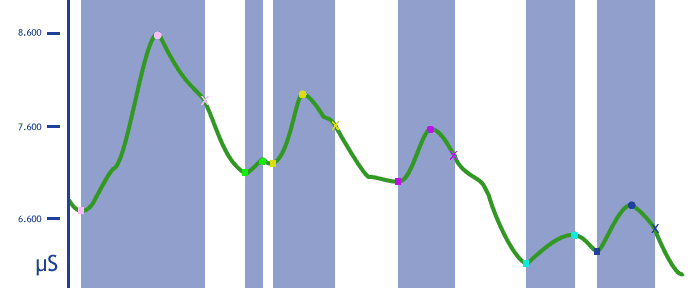
Phasic skin conductance refers specifically to Skin Conductance Responses (SCRs), which are represented by any significant increase in skin conductance, and are typically preceded by some sort of stimulus. Let’s mark the SCRs on the EDA waveform:
The uS Thesh setting specifies the minimum change in microsiemens necessary for an SCR to be detected.
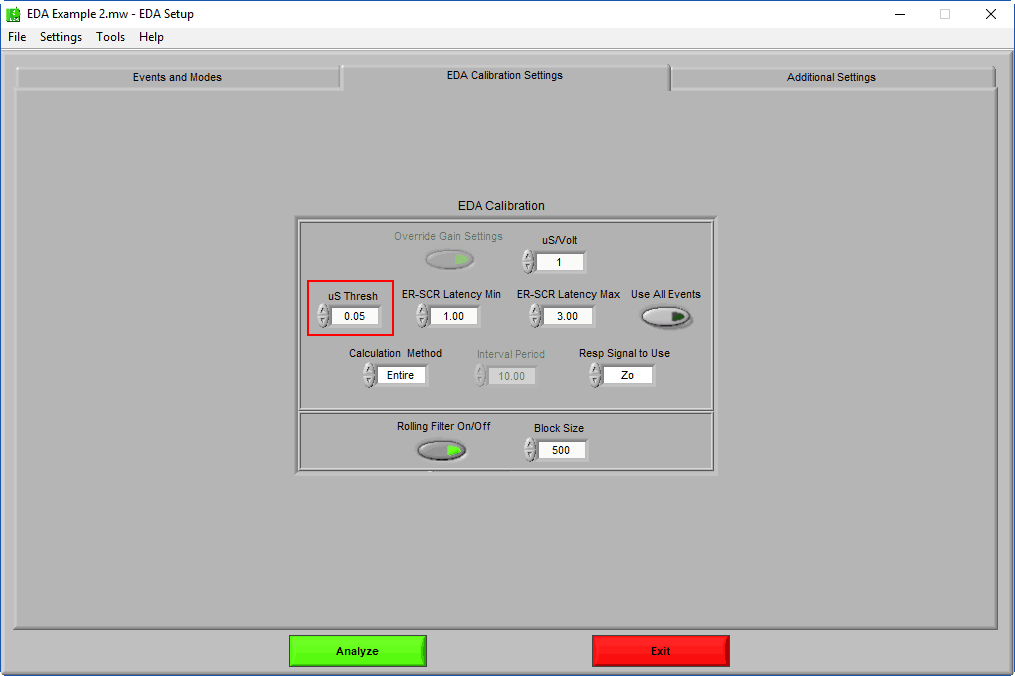
This value is typically set to 0.05 uS, but this is mostly due to historical limitations of recording equipment. Modern measurement techniques are capable of detecting changes even lower in amplitude, so it is possible to adjust this threshold. The psychological significance of smaller SCRs, however, is debatable.
Types of SCRs
Once an SCR is identified, there are two ways it can be classified. An SCR is considered non-specific (NS-SCR) if it does not occur as a result of a known stimulus. SCRs which do occur after a known stimulus are referred to as event-related (ER-SCRs).
Note: In order to classify an SCR as event-related, you must analyze in Event or Event & Time mode. See this video for more information.
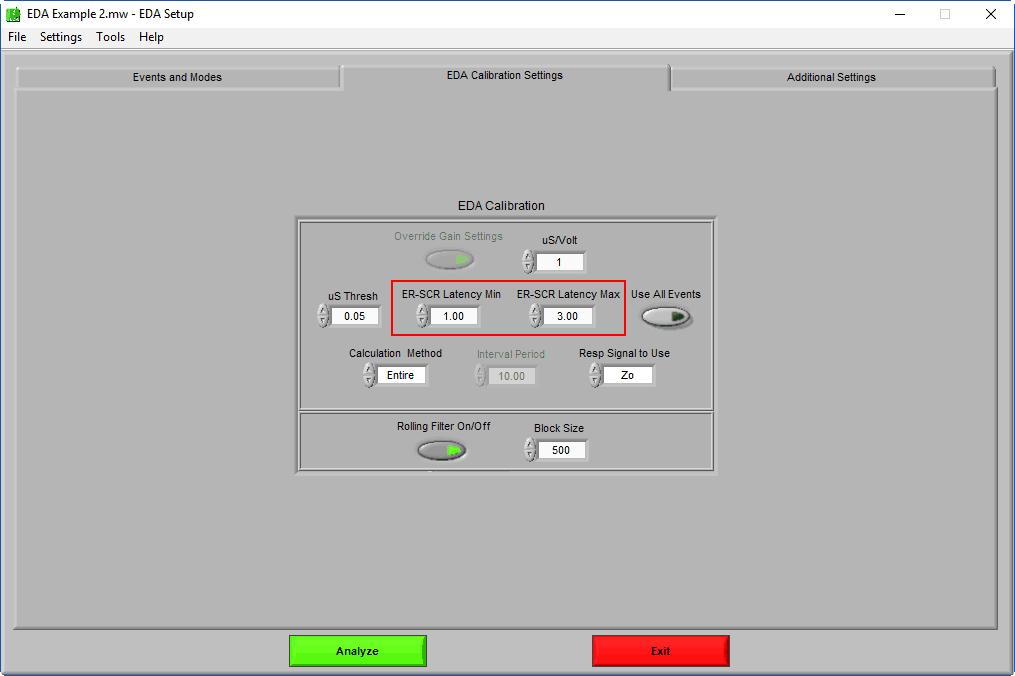
The SCR is relatively slow in terms of physiologic responses, typically taking 1-3 seconds to manifest following stimulus presentation. For this reason, the ER-SCR Latency Min/Max settings are used to define the time interval following an event in which an SCR must begin to be considered event-related
SCR Components
Take, for instance, this depiction of a single event-related SCR:
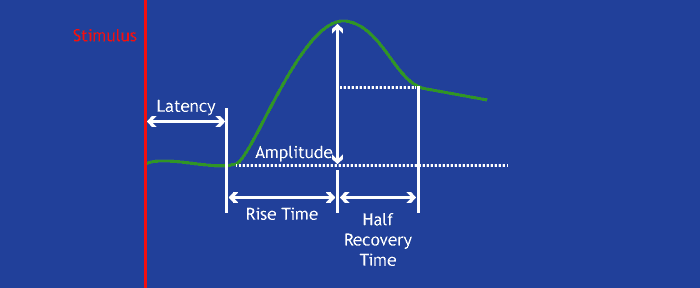
There are a number of components of an SCR which are of interest in quantifying the significance of the response:
Amplitude (uS) – Total phasic increase, from trough to peak, in skin conductance for a given SCR. An increased amplitude indicates a more intense response. This is the most commonly reported statistic for quantifying a response.
Latency (seconds) – When an SCR is event-related, this is the time interval between the event and the start of the SCR.
Rise Time (seconds) – Time interval between the start (trough) of the response and the maximum amplitude (peak).
Half Recovery Time (seconds) – Time interval between the maximum amplitude and the point at which the signal decreases to half of the max. The half recovery point is not always present, especially if a second SCR begins before conductance levels have dropped sufficiently
SCRs are identified in the EDA Analysis application in alternating colors to distinguish subsequent responses from one another
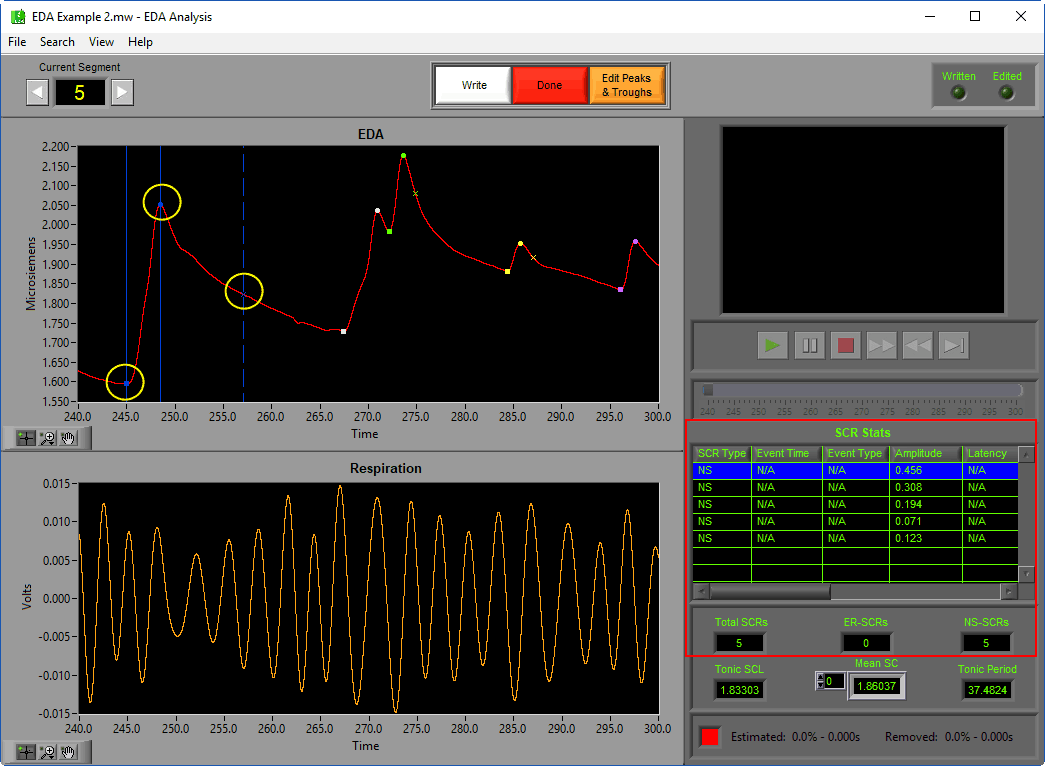
A square annotation is used to identify a trough, a circle for a peak, and an “x” for a half recovery point. Statistics related to the identified SCRs are found in the table to the right and below.
Tonic Skin Conductance
Tonic skin conductance refers to the rest of the signal, i.e. the parts which are not included in an SCR, as indicated by the portions of white in the following diagram
There are a couple of useful statistics which can be derived using tonic skin conductance:
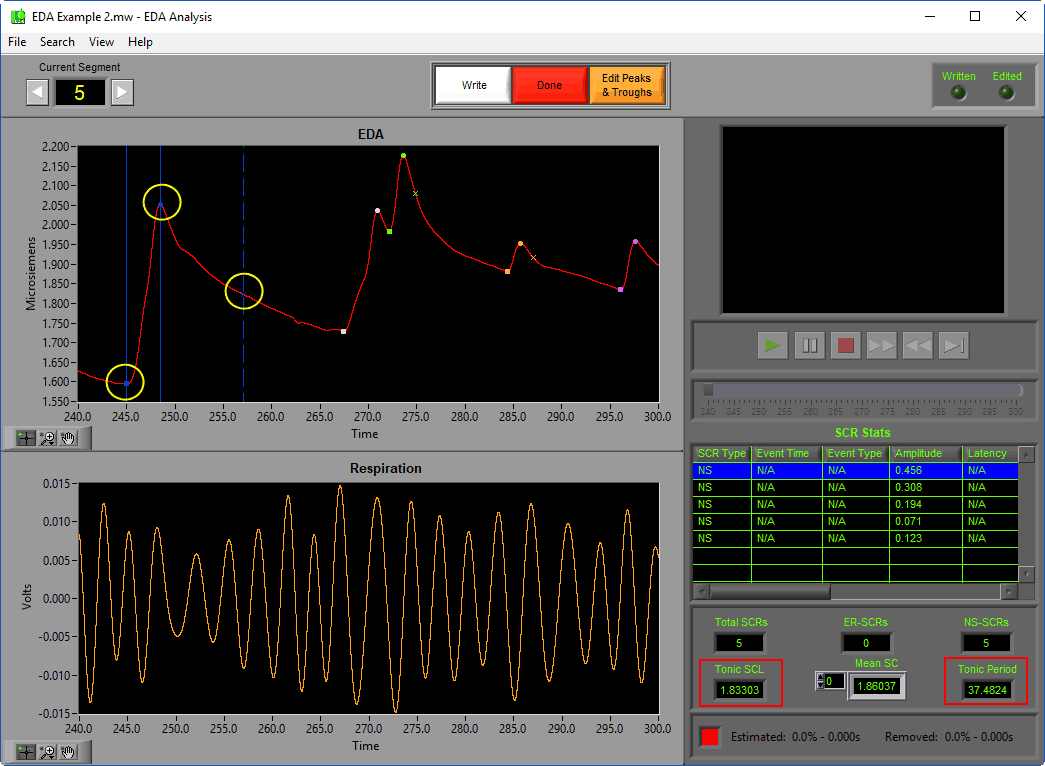
Tonic SCL – Average skin conductance level (uS) excluding SCRs. This can give a good approximation of baseline EDA for a given segment of data. Changes in Tonic SCL over time can be indicative of more general fluctuations in arousal.
Tonic Period – Total time (in seconds) during which an SCR is not occurring. It can be a useful indicator of overall activity in a given time period, where a higher Tonic Period corresponds to a reduced activity level.
These statistics can also be found on the analysis screen below the SCR stats.
Analysis Techniques
Depending on the type of study being run, there is a case for using each of the variables discussed above.
- When a study is stimulus-driven, and there are timed events available from which to view the data, it makes a lot of sense to examine ER-SCRs to quantify the response to a given stimulus.
- When a study is more epoch-based, and tasks occur over time rather than at a specific moment, changes in Tonic SCL and overall Mean SC from a baseline period to a given task are more useful metrics. Additionally, the number of NS-SCRs (typically reported in NS-SCRs/minute) can be indicative of overall arousal.
- Often times the study design mixes both epochs and specific stimulus presentation, in which case it makes sense to examine both tonic and phasic components of the signal.
Amplitude vs. Magnitude
When studying the phasic components of EDA, it is typical to repeat a particular stimulus several times to obtain an average representation of a subject’s response to it. There are a couple of ways to perform this average, and it is highly debated which method is superior. The amplitude refers to the average response amplitude across multiple trials only including trials in which an SCR was elicited, whereas magnitude represents the average response including trials with zero response. Historically, both have been reported in various cases, and we won’t make a case for one or the other in this article. It is, however, important to understand the difference between each of these methods. In many cases, it may be best to simply report both.
Note: Amplitude and magnitude are not statistics directly reported by the EDA application, but can easily be calculated from the output file.
Next time we will discuss some editing techniques related to EDA analysis.
Want to see SCR detection in action? Download the EDA Analysis 3.2 software for a fully functioning demo!