Last time we talked about the IBI series and how it is built from the detected R peaks on the ECG signal. Time-domain HRV statistics can be derived directly from the IBI series, but further processing is needed to extract specific frequencies of beat-to-beat variation. Most notable of these frequencies is “high frequency HRV”, which has been shown to be influenced almost exclusively by the parasympathetic nervous system.
Frequency-Domain Processing
To look at specific frequencies of variability we need to transform the IBI series from the time domain to the frequency domain. The MindWare HRV analysis application uses a Fast Fourier Transform (FFT) to do this, but the IBI series itself is not qualified to be transformed in this way. Instead, we need to manipulate the IBI series to get it ready for the FFT.
Heart Period Time Series
The requirements of a series being submitted to an FFT include:
- Evenly sampled data
- A sufficient number of samples, or data points, to measure the desired frequency
The IBI series in it’s current state meets neither of these criteria – the IBIs occur at varying times and they occur infrequently relative to the total time of the segment. These issues can be dealt with by taking our IBI series
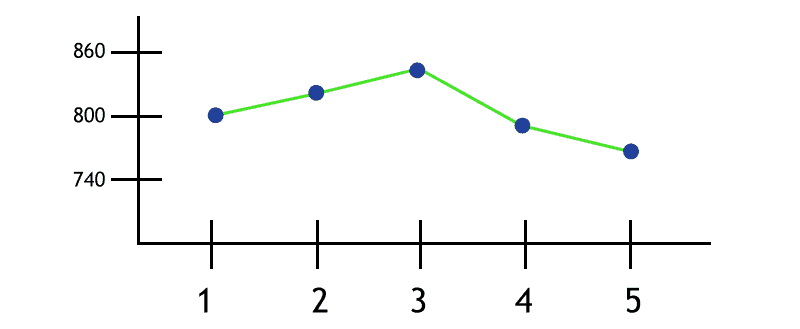
and interpolating to obtain a time-based representation known as the Heart Period Time Series
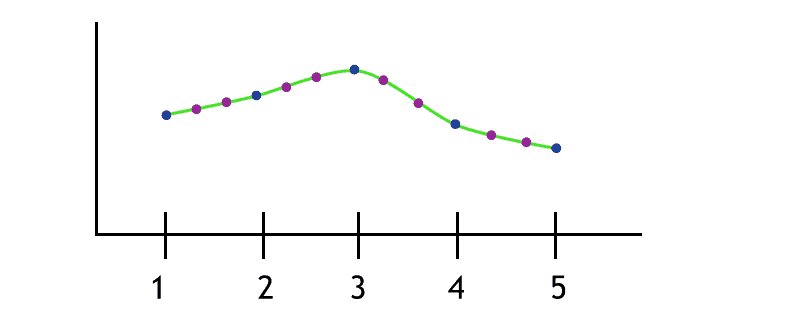
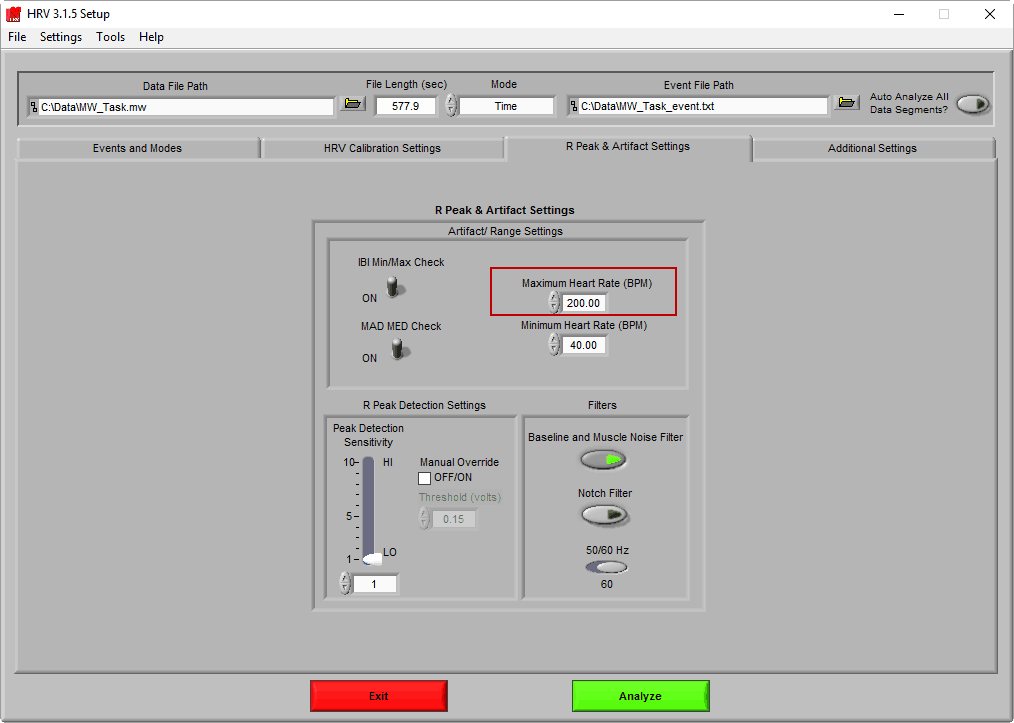
The frequency of the interpolation is set to be 10x the maximum acceptable heart rate, which is defined on the HRV Setup screen
This is done to ensure there are a sufficient number of data points to capture frequencies across a variety of species where common heart rates may far exceed that which is typical in human physiology. The Heart Period Time Series is then detrended to minimize non-stationarity in the data and remove the amplitude offset which only serves to obscure important frequency content of the series.
The series is now ready to be passed to the FFT for frequency analysis.
Heart Period Power Spectrum
The FFT is one of a few methods for obtaining a power spectrum representation of a data series, where the power of specific frequencies in a complex signal can be isolated and quantified. When looking at the frequency content of the Heart Period Time Series, we refer to this plot as the Heart Period Power Spectrum.
The series is first tapered using a windowing function defined on the HRV Setup screen
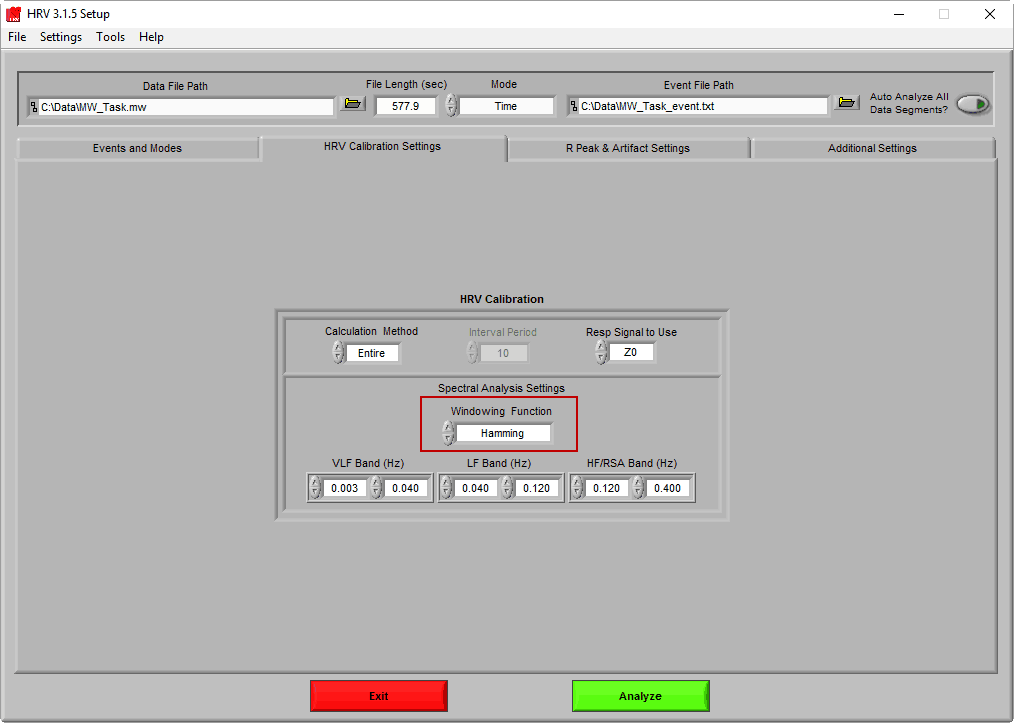
Most commonly used is the Hamming window, however there are a number of windowing functions to choose from.
The result of the windowing function is then passed to the FFT to obtain the power spectrum
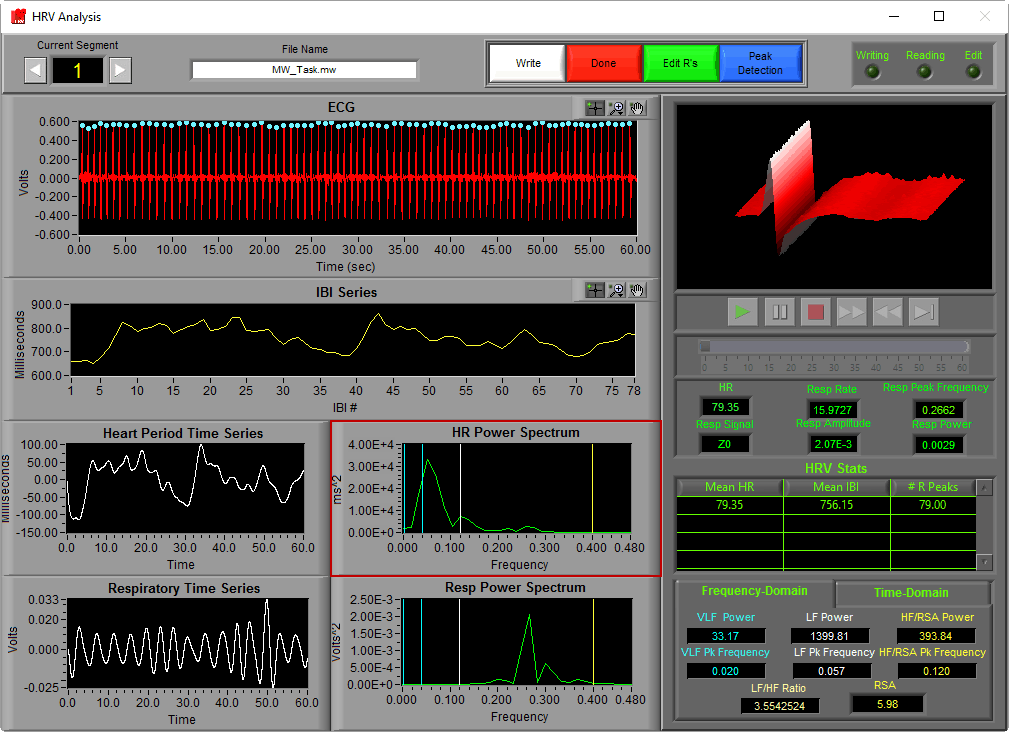
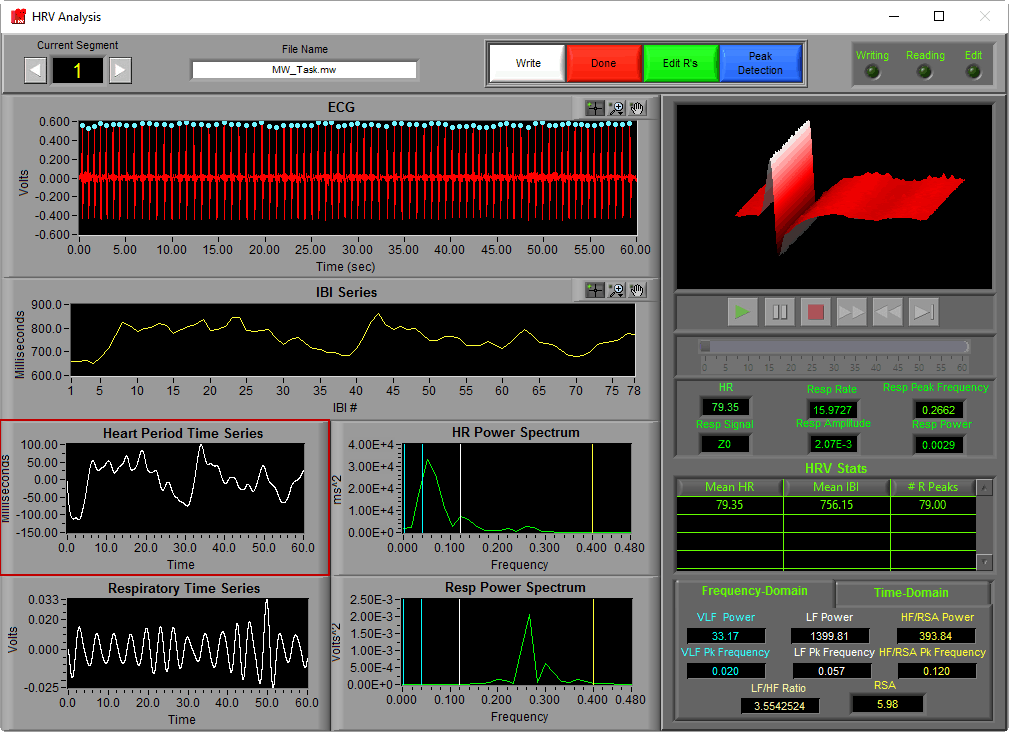
You will notice that there are colored vertical lines on the power spectrum graph. These correspond to the 3 frequency bands of most interest to heart rate variability – Very Low Frequency (VLF) in blue, Low Frequency (LF) in white, and High Frequency (HF/RSA) in yellow. The frequency bands are also specified on the setup screen

The recommended frequency ranges are highly dependent on the age/species of the subject, so be sure to adjust these accordingly.
Frequency-Domain Statistics
Frequency domain statistics can be viewed by selecting the Frequency-Domain tab on the HRV Analysis screen
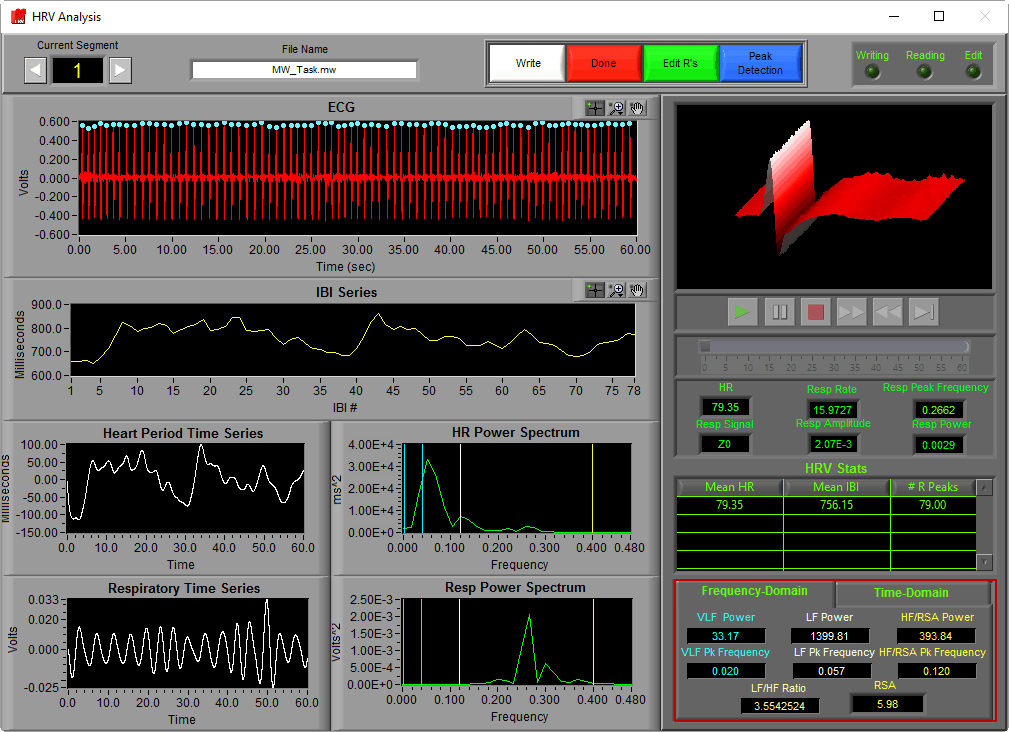
For each band, Power is defined as the integral of the waveform in that band, and Pk Frequency is the frequency with the highest power in the band. Each band has different significance from a physiological perspective
VLF
Less is known about the physiological significance of very low frequency HRV than the other two frequency bands. Variability in this range has been attributed to Mayer waves and circadian rhythm, but certainly begs further exploration. VLF is most commonly used in clinical applications as a predictor of cardiac condition outcomes. It is recommended to study this range using ECG recordings greater than 5 minutes in duration.
LF
The low frequency band was once thought to be representative of sympathetic activation, but recent studies have argued it actually represents influence by both sympathetic and parasympathetic branches of the autonomic nervous system.
HF/RSA
The high frequency band is also referred to as the RSA band due to the influence in this range of respiration on beat to beat variance. This frequency band in particular has been shown to represent parasympathetic nervous system regulation almost exclusively, and thus is a highly sought after metric.
There is a lot of information here, and if you don’t understand everything right now don’t worry – the more you analyze for HRV and read about these methods, the more clear they will become.
Next time we will talk about quantifying respiratory sinus arrhythmia and using respiration to validate it.