Now that we have laid a basis for what HRV is and what signals are necessary for studying it, we need to talk about the process by which important statistics are calculated. It all starts by building something called the IBI series.
IBI Series
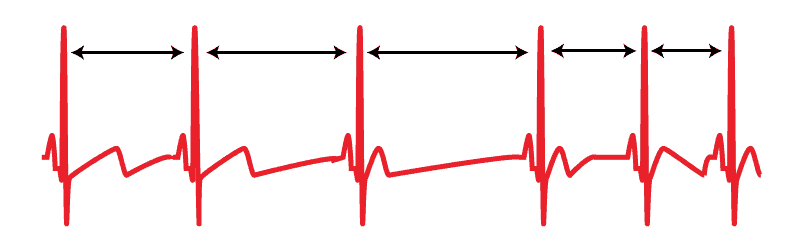
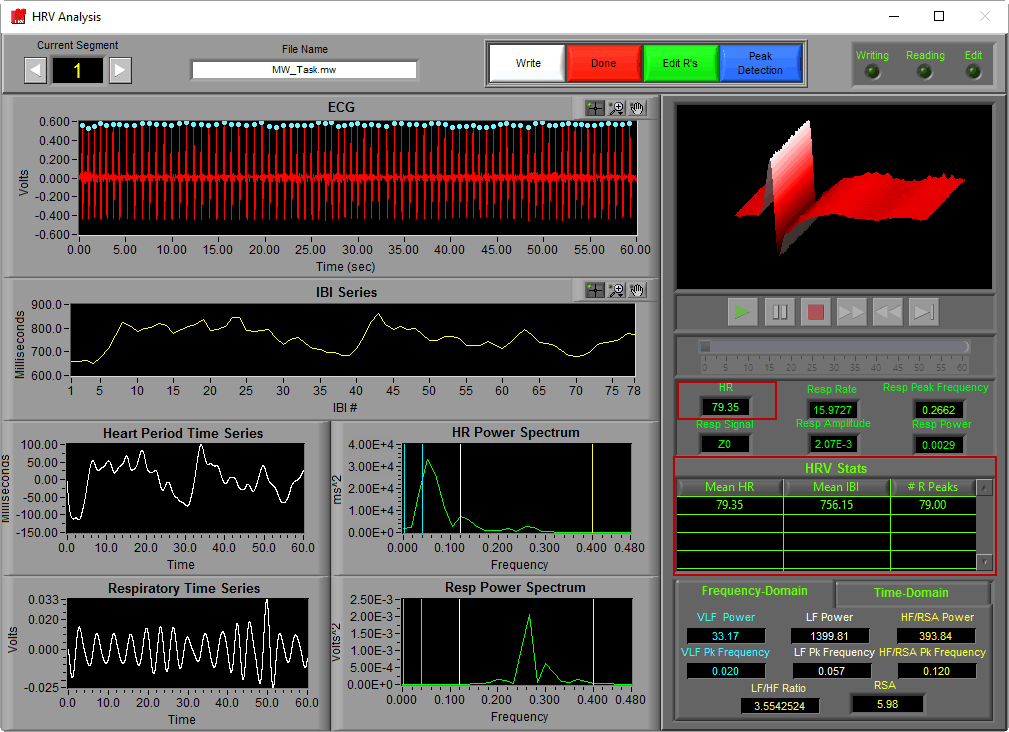
If HRV is the study of variability in beat to beat timing, the first step is to determine the timing between beats. That time is referred to as the Interbeat Interval, or IBI for short. It is also sometimes referred to as heart period. When using the ECG series, this is defined as the timing between subsequent R peaks.
R peak detection in the HRV analysis application is described in detail here. Detected peaks will appear on the HRV Analysis screen as colored dots on the ECG signal.
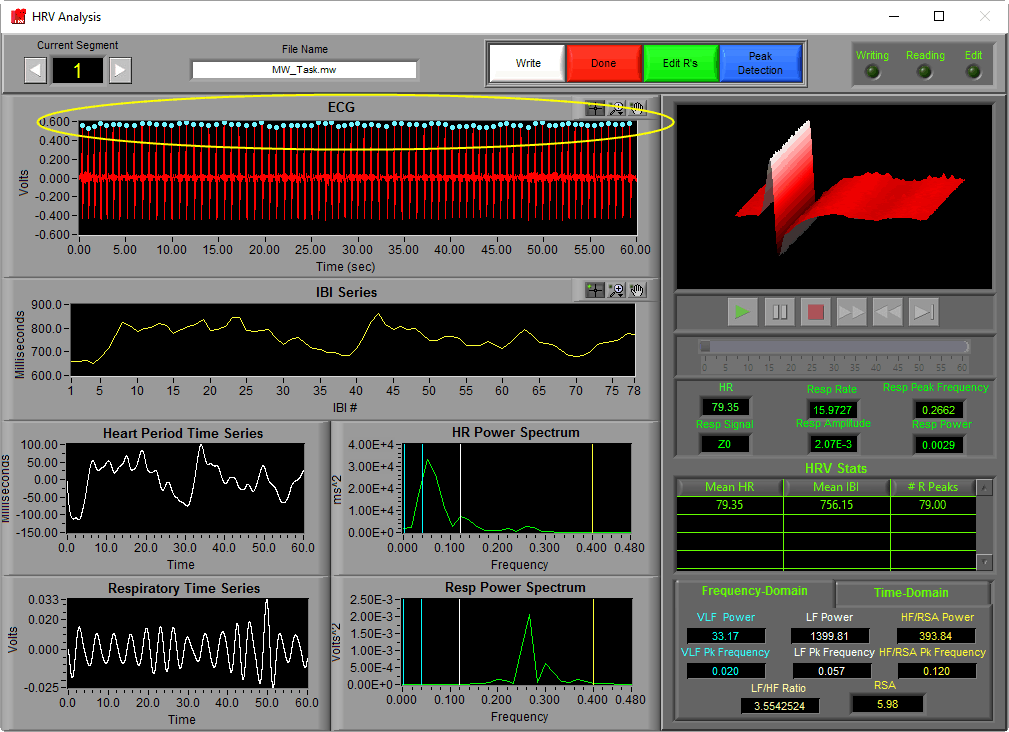
The color of the peak indicates whether or not it passed the artifact detection algorithms’ criteria. In the HRV application, all peaks are used regardless of whether they are marked “good” or “artifact”. We will get into this a bit more when we talk about editing techniques.
Once peaks are detected, determining the IBI for subsequent beats is as simple as subtracting the time at which they occur from one another. By doing this for each pair of beats in a segment and plotting those values, we obtain the IBI series.
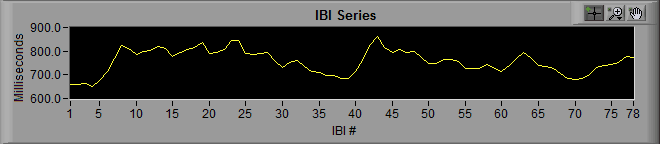
Notice that the y-axis is labeled “milliseconds” and the x-axis is labeled “IBI #”. When we are viewing an IBI series, we are no longer looking at signal which corresponds to segment time. Rather each data point refers to a specific interval that occurred at some time during the segment, with its value being its duration.
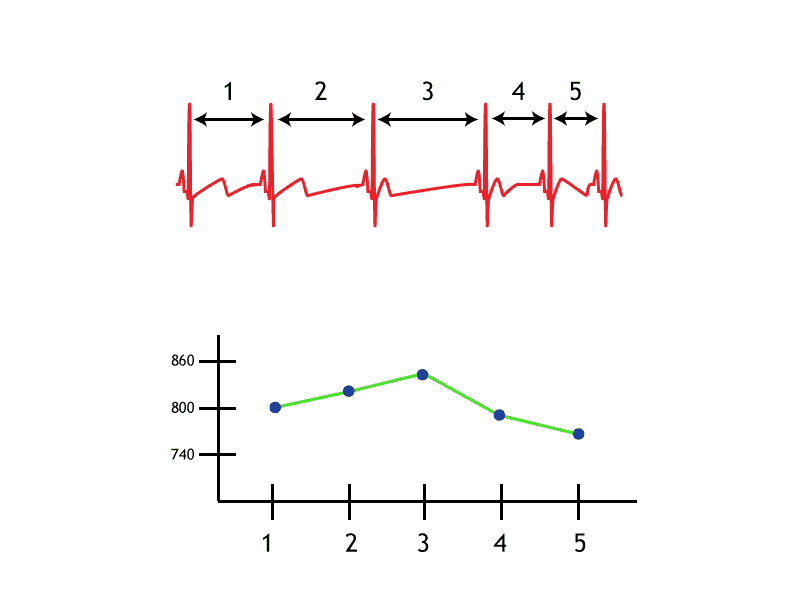
By zooming in a bit, we can see that as heart rate decreases, IBI increases, and vice versa. This is because as the rate of beats increases, the time between subsequent beats decreases.
Time Domain Statistics
From the IBI series alone we can derive a number of interesting statistics:
Heart Rate, Mean IBI, and # R Peaks
Heart rate, while not definitively affected by either sympathetic or parasympathetic influence, is still an extremely important statistic to report for many studies. It is typically reported in beats per minute (BPM) and is, as mentioned above, inversely related to IBI
![]()
In this equation, IBI actually refers to Mean IBI, which is simply the average IBI for the segment of time.
# of R Peaks is pretty self explanatory – it is the number of peaks detected in the segment. Due to the fact that an IBI requires 2 subsequent peaks to define, this value will always be one greater than the number of points in the IBI series.
Note: It is possible to calculate these statistics on smaller “intervals” within the selected time segment. This is commonly done to obtain second-by-second heart rate. Heart rate is calculated slightly differently when doing this.
Time-Domain HRV
Time-domain HRV statistics are all derived directly from the IBI series, rather than looking at the frequency-domain transformation. Part of the advantage of using these variables is the relative ease of calculation, and the fact that there is really only one method to calculate them, making for better comparisons between studies. The disadvantage is that they are not universally accepted as an accurate of a representation of specific ranges of variability, meaning a less reliable index of autonomic influence.
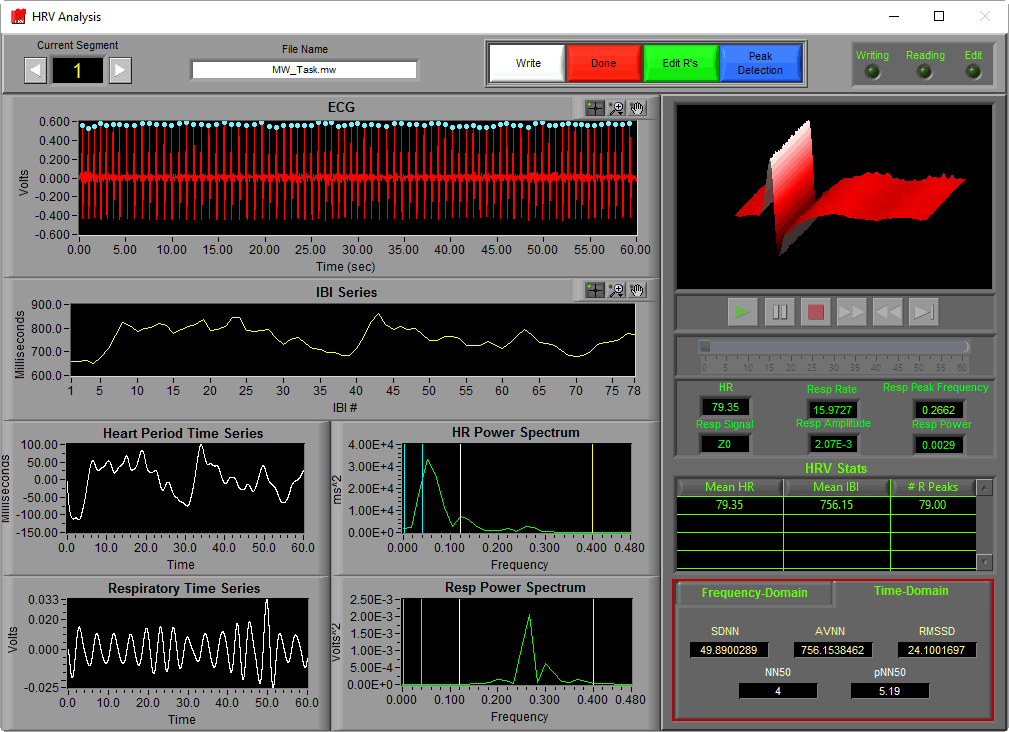
To view the time-domain stats in the HRV application, select the Time-Domain tab in the lower right hand corner of the analysis screen
You will notice the characters NN appear in the names of many of these statistics. N-N interval is another way of saying R-R interval, or the time interval between R peaks. The letter N is used to distinguish that these statistics are intended to derive from “normal” R-R intervals, or R-R intervals which represent normal cardiac timing and are free from artifact.
SDNN
SDNN stands for standard deviation of N–N intervals, and is calculated by simply taking the standard deviation of the IBI series. It is typically used as a representation of total variability of a segment.
AVNN
AVNN stands for the average N–N interval, and should equal Mean IBI for a segment.
RMSSD
RMSSD is the root mean square of successive differences. It is calculated by taking the RMS of differences between successive N-N intervals. This is a commonly used statistic as it has been shown to correlate highly with high frequency HRV.
NN50 and pNN50
Like RMSSD, NN50 and pNN50 have been shown to be representative of changes in high frequency HRV. NN50 represents the number of N-N intervals which differ by more than 50 milliseconds from the previous interval, and pNN50 is the proportion of these intervals relative to the total time segment.
Next time we will perform further processing on the IBI series to extract specific frequency content and determine respiratory sinus arrhythmia (RSA) among other frequency domain statistics.