When attempting to analyze and report ECG data in the frequency domain it is important to understand that you may need to adjust certain settings based off of the subject’s age or state of activity (resting or exercising). This article will primarily focus only on adjusting the high-frequency bands of heart rate variability in order to accurately observe Respiratory Sinus Arrhythmia (RSA). Please see this article for more information about RSA.
Default Settings
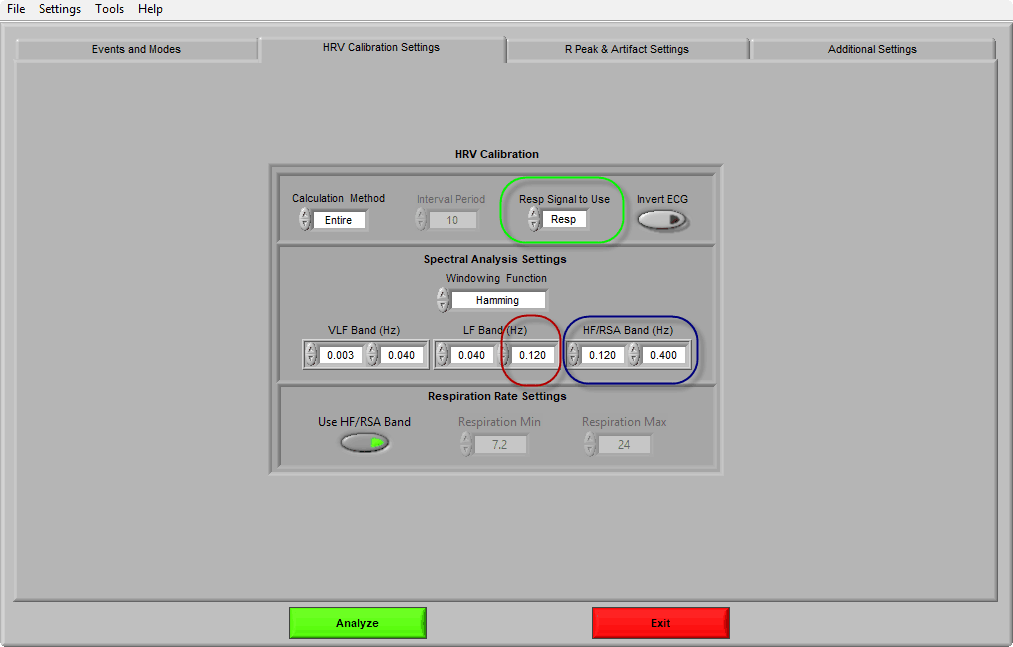
Below is an image from the “HRV Calibration Settings” tab in the MindWare HRV analysis application with default settings applied. Notice that within the green rectangle a respiration channel has been selected. In this case, “Resp” (a respiration belt) is being used to directly measure respiration, but you may also derive respiration from the Impedance Cardiography waveform which would appear as “Z0” within the green rectangle location. Please see this article for more information about deriving respiration from Impedance Cardiography.
Within the blue rectangle, you will notice the application’s default settings for the high-frequency band. The red circle highlights the upper limit of the low-frequency band or “LF Band (Hz)” seen on the below image. It is important to note that if you make any adjustments to the lower limit of the high-frequency band you should also adjust the upper limit of the low-frequency band to match. E.g., in this example, you will notice that the upper limit for the low-frequency band matches the lower limit for the high-frequency band which is 0.120Hz.
Adults
For adults, the standard high-frequency band may be set to 0.15 (or .12) to 0.4Hz¹. However, it is possible for an adult subject’s respiratory rate to fall outside of these parameters in cases of limited or rapid respirations.
If a study is conducted in which you might expect the respiration rate of the adult subjects to be above 24 cycles per minute it is normally recommended that the higher band cut-off is set to a higher value. For example, when analyzing ECG data from adult subjects that were exercising during the time of data collection, a high cut-off band setting of 1.0Hz may be optimal¹.
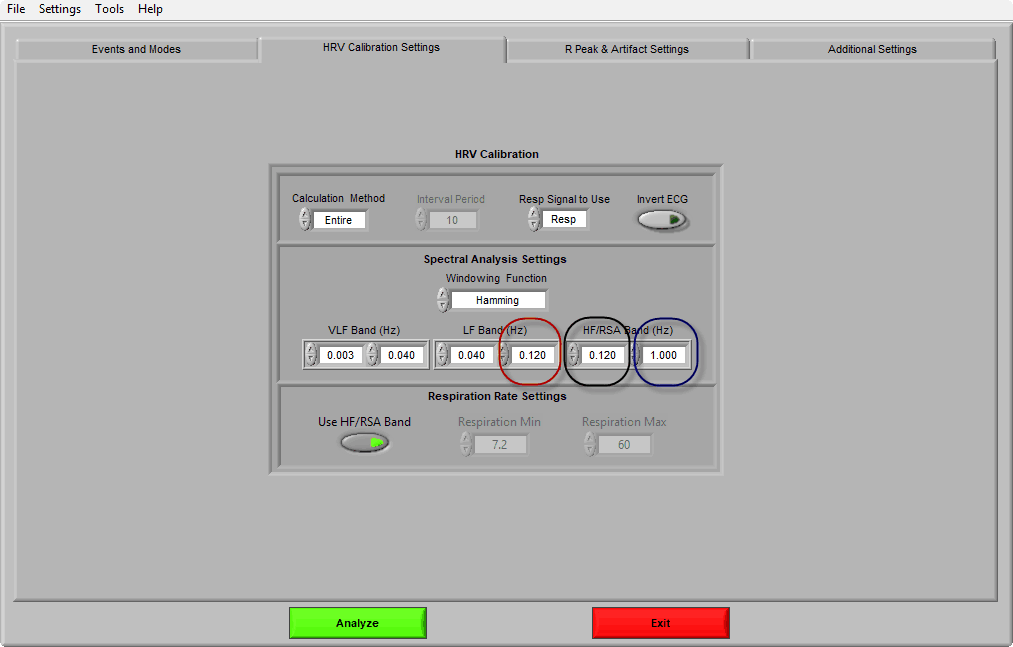
Below is an example of what the high-frequency band settings could be set to for an adult exercising during ECG collection. Notice that the upper limit of the high-frequency band has changed to 1.000Hz (blue circle) to capture the higher frequencies produced from the elevated heart rate and faster respirations expected from exercising. The lower limit for the high-frequency band (black circle) still matches the upper limit for the low-frequency band (red circle).
Children and Infants
Children and infants have a higher heart rate and breath more rapidly than adults. Because of this change in rates, a standard adjustment to the high-frequency band may be necessary when analyzing data from children or infants. A typical frequency band setting of 0.24 to 1.04Hz is used for children and infants².
Below is an example of what the high-frequency band settings could be set to for child ECG data. In this example, you will notice that the upper limit for the low-frequency band (red circle) has been adjusted to match the lower limit of the high-frequency band (black circle). The upper limit of the high-frequency band (blue circle) has also been changed to a limit that should more accurately capture the higher heart rate and faster breathing expected from child subjects.

Validating RSA with Respiration
The peak frequency at which the subject was breathing should fall within the same high-frequency band limits you are using to measures RSA in the heart rate power spectrum. If the respiration peak frequency falls outside of your high-frequency band limits for any given study it is normally suggested that you discard that segment or epoch and do not use it for statistical analysis. It is also important to note that you will want to use the same frequency settings for all subjects that you intending to conduct between-subject analysis on. Please see this article for more information about validating RSA with respiration.
Below is an image of the HRV Analysis screen. In this example, the high-frequency bands were set from 0.12 to 0.4Hz and you will notice that, in this segment, the respiration peak frequency is 0.2471 volts squared which falls safely within the bounds of the “HR Power Spectrum”.

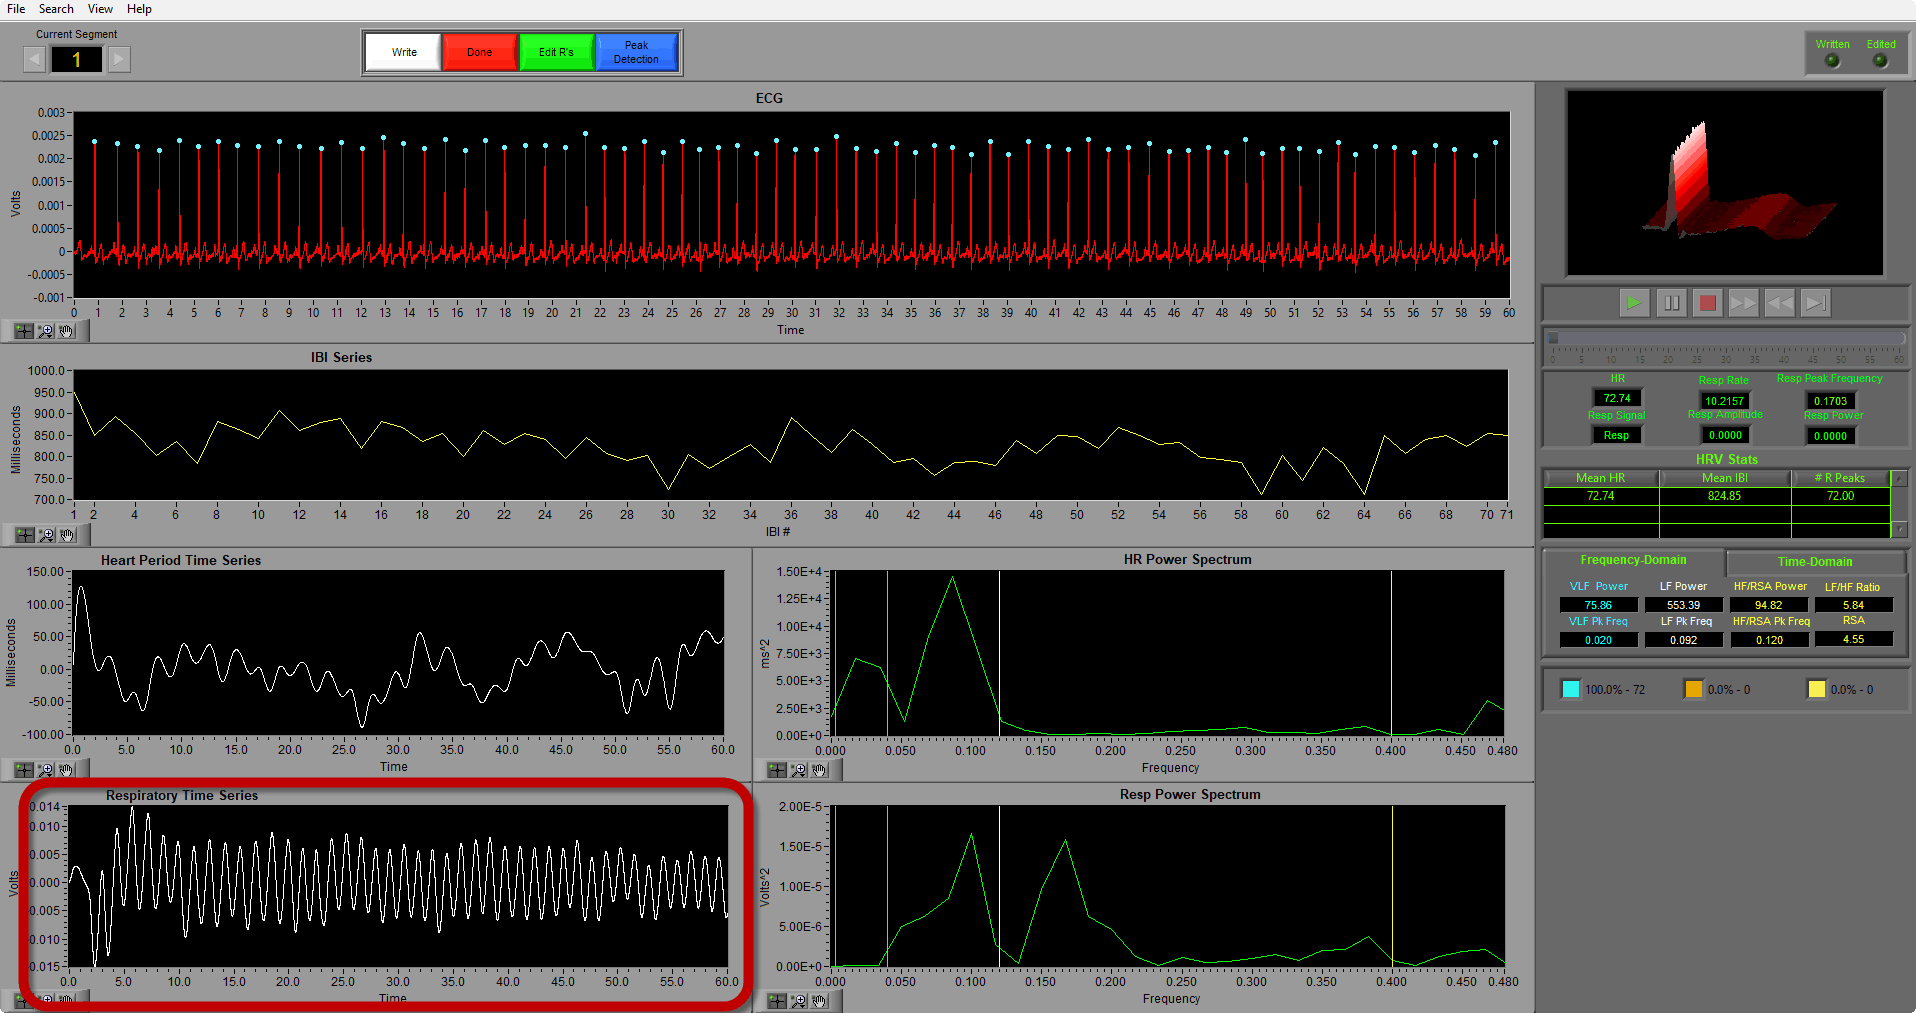
The image below has the high-frequency bands set from 0.12 to 0.4Hz and the HRV analysis application displays a respiration rate of 10.21 cycles per minute with a respiration peak frequency of 0.1703 volts squared. This may seem like a lower respiration rate for an adult, however, if you look at the “Respiratory Time Series” graph (highlighted with a red rectangle) you will notice that there are easily more than 10.21 respiratory cycles. This is one of the main reasons why the upper limit of the high-frequency band should be adjusted if you know the subject is a child or if you expect your subject to have been breathing more rapidly than normal.
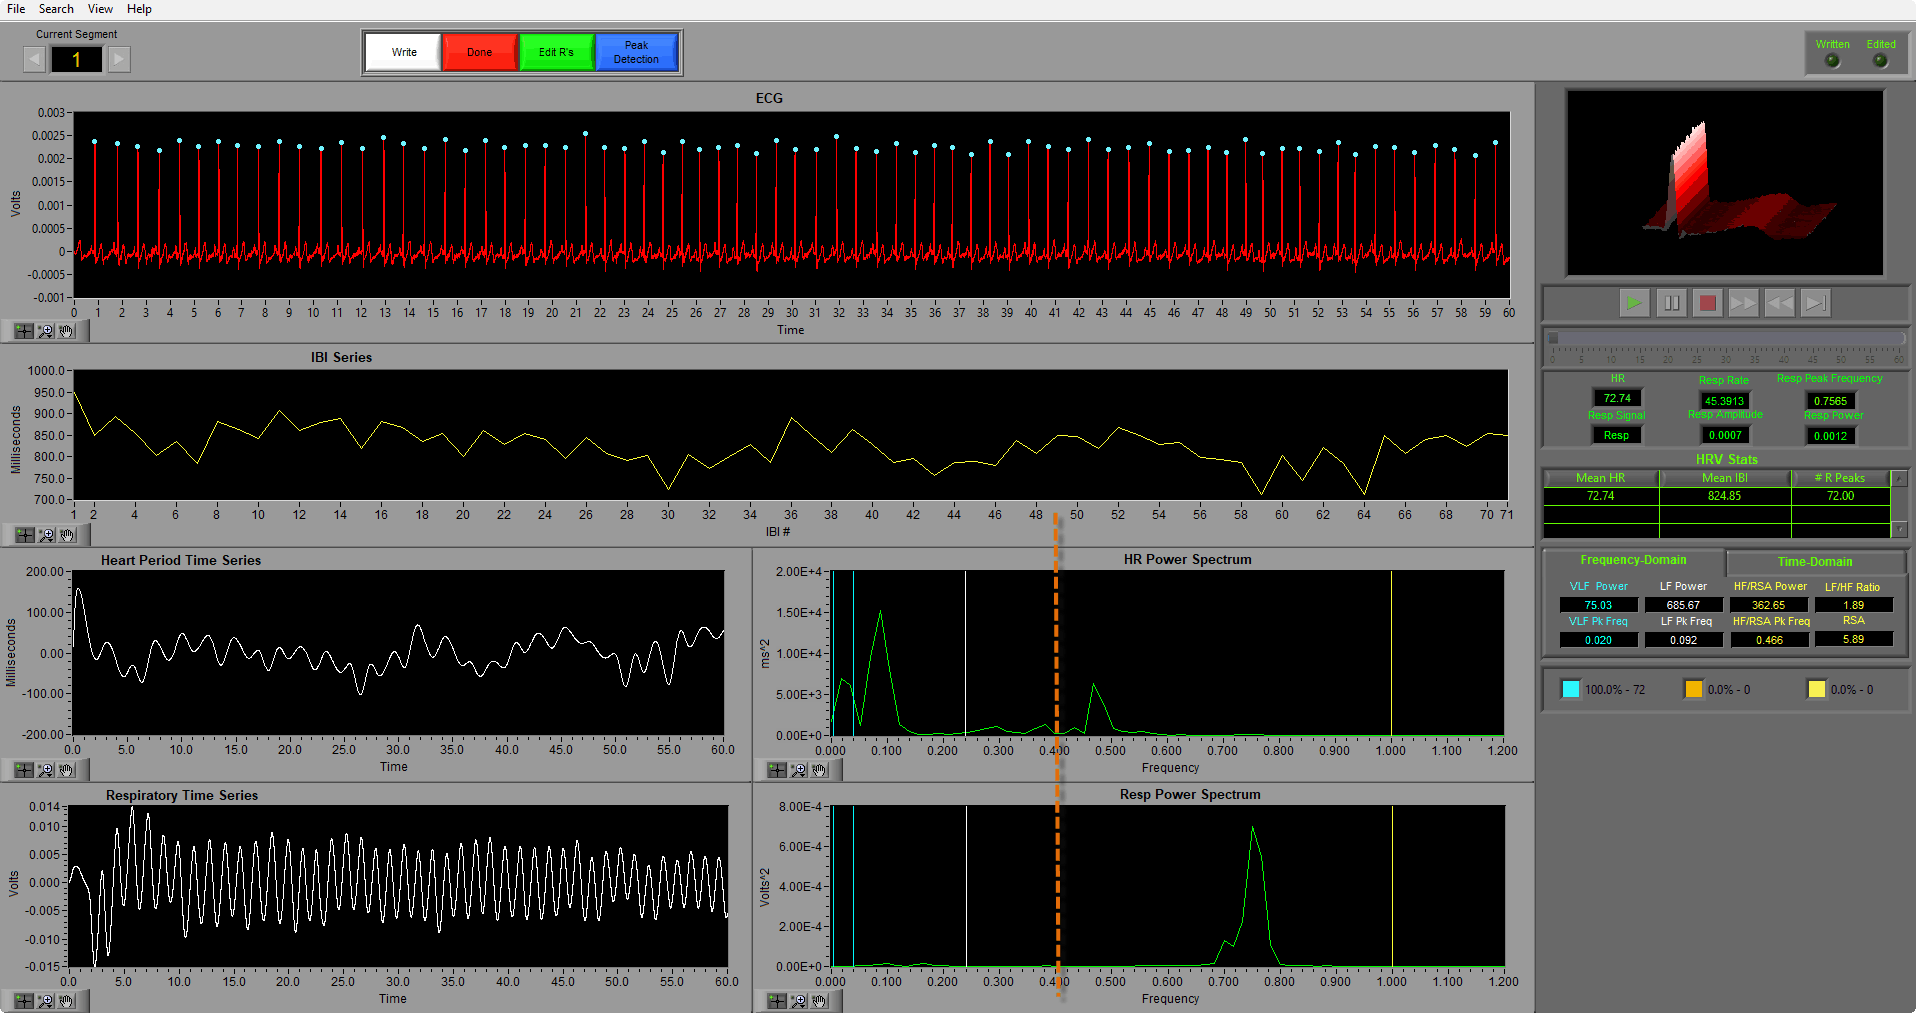
If the settings used in the above image had been set correctly you would have noticed that the actual respiration rate was probably closer to 45 cycles per minute with a peak respiration frequency of 0.7565 volts squared as seen in the image below. An orange dashed line has been overlayed at 0.4Hz in both power spectrums in the example below. You can see from this image that if the upper limit of the high-frequency band was not adjusted to control for the faster respiration rate a lot of information would be lost as everything to the right of the orange dashed line would not be captured.
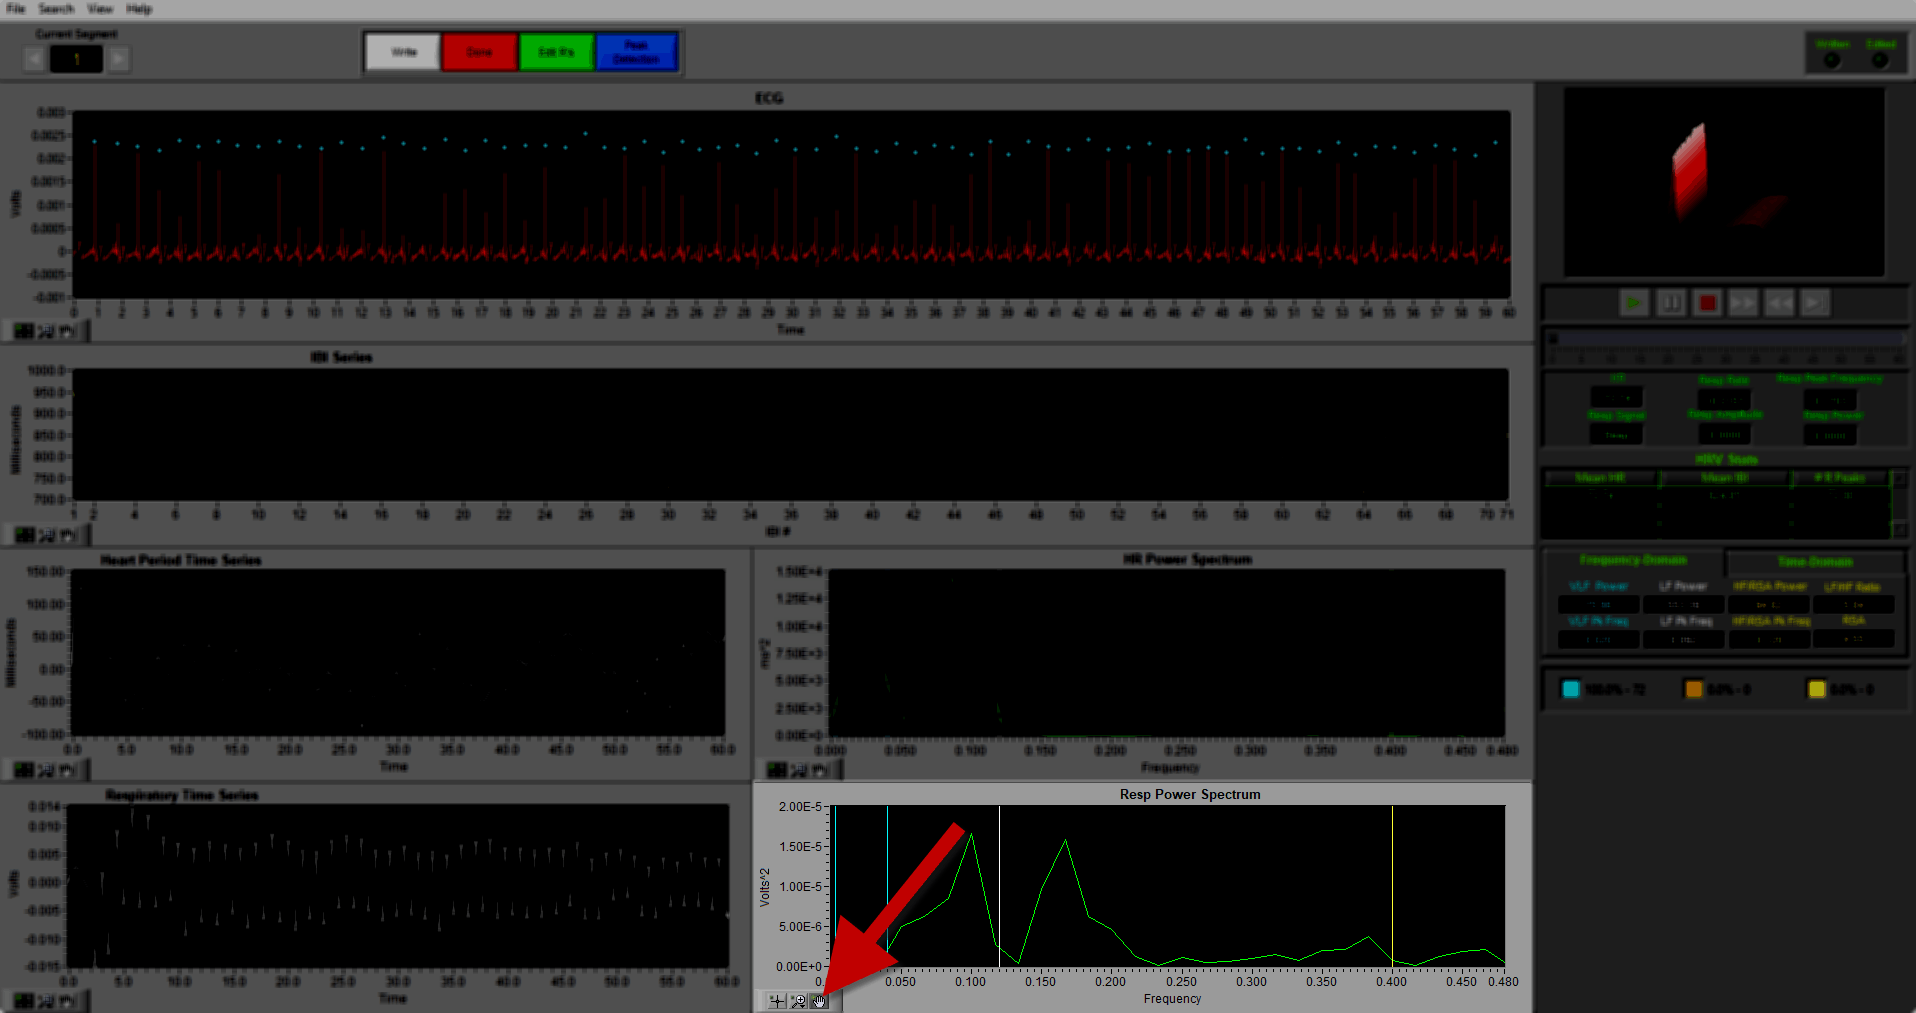
Sometimes the subject’s respiration data will not be captured as clearly as it was in the image above. This can be due to extreme subject movement or respiration belt shifting during the data acquisition. Because of this, you may not always be able to count the actual inhalations and exhalations but, in general, it is a good idea to keep an eye on the respiratory time series chart to see if it looks abnormal. If you are ever in question of a subject’s respiration power, you may always select the panning tool in the bottom left corner of the respiration power spectrum graph in order to click and drag the chart to the right to see if there is a significant amount of information that you may be missing.
The panning tool is located at the bottom left of the respiration power spectrum window and looks like a hand. Please see this article for more information about the graph tools.
References
- Cacioppo, J. T., Tassinary, L. G., & Berntson, G. G. (2017). Handbook of psychophysiology (4th ed., Pp. 197-198). Cambridge: United Kingdom.
- Bar-Haim, Y., Marshall, P. J., & Fox, N. A. (2000). Developmental changes in heart period and high-frequency heart period variability from 4 months to 4 years of age. Developmental Psychobiology,37(1), 44-56. doi:10.1002/1098-2302(200007)37:13.0.co;2-7
Recommended Readings
- Shader, T., Gatzke-Kopp, L., Crowell, S., Jamila Reid, M., Thayer, J., Vasey, M., . . . Beauchaine, T. (2018). Quantifying respiratory sinus arrhythmia: Effects of misspecifying breathing frequencies across development. Development and Psychopathology, 30(1), 351-366. doi:10.1017/S0954579417000669