As we continue our series on the ECG signal, we need to look at abnormal ECG signals and how to handle them in analysis. Diagnosis of specific conditions is best left to cardiologists and so we are not going to get deep into the identification of specific cardiac conditions (if you are interested, read this). However, we are interested in studying normal control of the sinus rhythm, not abrupt changes in the cardiac cycle which can result from an arrhythmia. So, it is very important that we are at least able to recognize when an abnormal beat is occurring and correct for it.
Common Signs of Arrhythmia
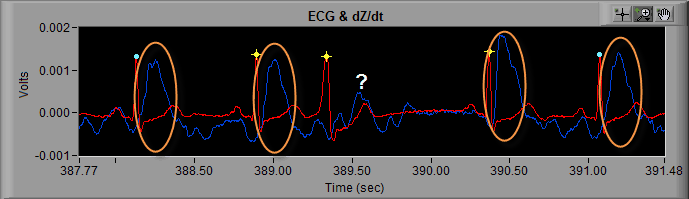
Take the following section of ECG for example:
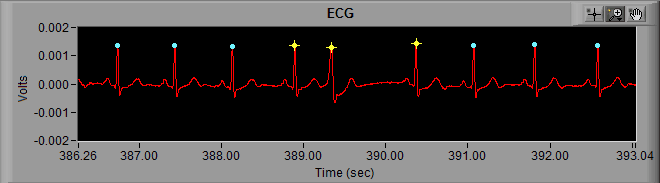
From the previous posts about artifact identification, we know that we need to more closely examine the R peaks marked with a yellow star. At first glance these looks all look like actual heart beats because, well, they are… but at around 389 seconds, something looks out of place.
First, lets recall the components of an ECG cycle. Preceding the QRS complex is the P wave, and the beat occurring after 389 seconds is missing a P wave. The QRS complex begins immediately following the T wave of the previous ECG cycle.
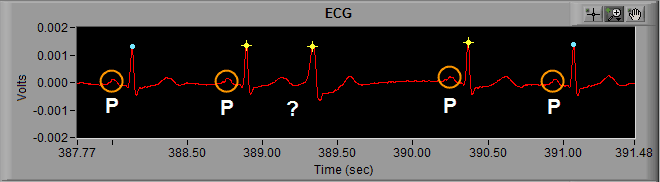
We can also notice the QRS complex is wider than normal, or at least wider than the cycles of ECG in the rest of the segment.
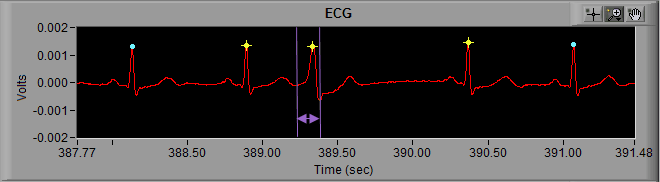
Finally, we can visually confirm that the IBI changes drastically with this abnormal beat. The IBI preceding it is abnormally short, and the IBI immediately following it is abnormally long.
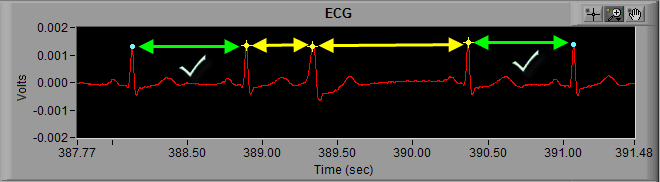
This is the most immediately noticeable indication of an arrhythmic beat, and is also the reason that the beat is flagged with a yellow star in the first place. The change in IBI is flagged by the dual artifact detection algorithms as potential error. In this case, the peak detector did correctly identify an R peak, but its a peak that we don’t want to use when calculating the statistics.
Additional Signs of Arrhythmic Beats
Some additional signs of arrhythmia include:
- Elongated P-Q interval
- P wave with no subsequent QRS complex
- Shortened P-R interval
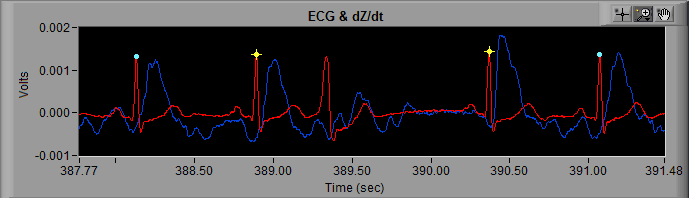
If you are collecting cardiac impedance (IMP), many times an arrhythmic beat will be accompanied by abnormal or missing dZ/dt cycle. If we look at this same segment of data in the IMP analysis application, we can see that the abnormal beat is not followed by a dZ/dt cycle, unlike every other beat in the segment.
Editing Arrhythmic Beats
Now that we have identified a beat as abnormal, we need to remove it from the series to prevent corruption of the resulting statistics. The reason for doing this, and the editing technique employed, differs a bit when editing in the HRV and IMP analysis applications.
Editing Arrhythmia in Impedance Cardiography
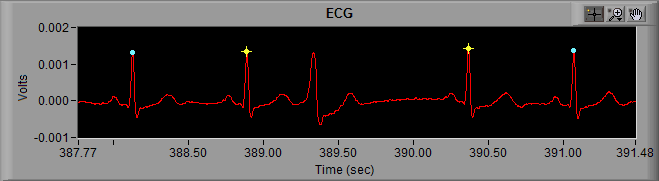
We will start with editing for IMP because it is much easier. Here we go: when you come across an arrhythmic beat, delete it.
The reason we do this is, by leaving it in, both the ECG and dZ/dt Ensemble Averages would be corrupted. With IMP we are looking at the timing between components on the ECG and dZ/dt waveform. This timing can (and will) shift if an abnormal ECG or dZ/dt cycle is included in the average. With this particular segment, we would be including noise in the dZ/dt Ensemble Average by leaving the abnormal beat marked.
Editing Arrhythmia in Heart Rate Variability
Editing for HRV is a bit more complicated because we need to maintain consistent timing throughout the segment when deriving RSA. We are going to start the same way, by deleting the abnormal beat, but now we have created a single abnormally long IBI which will increase the total variability of the segment.
If you were paying attention last time you may have figured this out, but to remedy this we are going to place an Absolute Midbeat between the 2 known good cycles of ECG on either side of the abnormal beat.
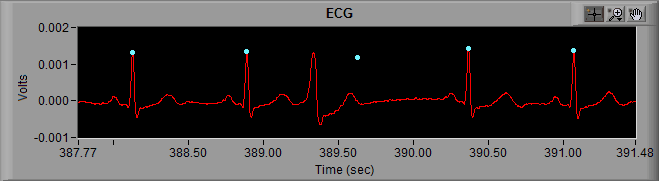
Note: Since there is an R peak between these 2 beats, it is important to turn Midbeat Autopeak OFF in the ECG Editor or the application will try to mark the R peak again
Now the timing has been restored to the best of our ability, and the influence of the arrhythmia has been (mostly) removed from the statistics.
To make things more complicated…
In the above example, the Midbeat resulted in a new beat which is flagged with a blue dot, meaning it falls within the timing criteria of the artifact detection algorithms. This implies that the arrhythmia did not reset the normal sinus rhythm, and estimating the location of the R peak in the absence of the arrhythmia is acceptable.
Certain arrhythmia and cardiac conditions, however, result in a reset of the sinus rhythm. In this case even placing a Midbeat will not result in preserving the timing structure of the data, and will lead to an increased measure of variability within a segment for HRV. This is truly problematic because there is little that can be done about it. Here are your options:
- Delete all R peaks leading up to the abnormal beat, or all R peaks following the beat. This will allow you to analyze over a contiguous series of beats in which normal sinus rhythm has not been reset. Again, remember that you need at least 30 seconds of ECG to calculate RSA, so if you take this route be sure not to break that rule.
- Estimate the best you can by performing a Midbeat anyway. Since we know that by doing this we are increasing the variability of the segment, it is best to limit these edits to 1-2% of total peaks.
Now you know how arrhythmia and cardiac conditions affect statistical analysis of HRV and IMP, how to identify these abnormal beats, and some methods for dealing with them. Along with the rest of the tools presented throughout this series, you should now be ready to confidently and correctly deal with a wide array of ECG signal morphology.