All About Heart Rate Variability
Heart Rate Variability, or HRV for short, is the measure of variation in timing between successive heart beats. It has been shown that heart rate and HRV are regulated by both the sympathetic (SNS) and parasympathetic (PSNS) branches of the autonomic nervous system (ANS). Only looking at total variability, or by simply reporting heart rate, it is not clear which side of the autonomic nervous system is active at a given time. Depending on what is being studied, it can be desirable to distinguish between sympathetic and parasympathetic influence.
By breaking down HRV into frequency components, it is possible to isolate a specific range of frequencies which has been shown to correlate almost exclusively to parasympathetic nervous system activity. This range of frequencies, known as high frequency HRV, is associated with a physiological phenomenon known as Respiratory Sinus Arrhythmia (RSA). This blog series is intended to discuss the process by which this and many more statistics are calculated using the MindWare HRV analysis application.
Before we start talking about how these various statistics are calculated, we need to define the signals needed for studying HRV.
HRV Signals
ECG
The electrocardiogram (ECG, or EKG) is the only required signal for studying heart rate variability
(well, that statement is not entirely true, but we will discuss in a bit why)
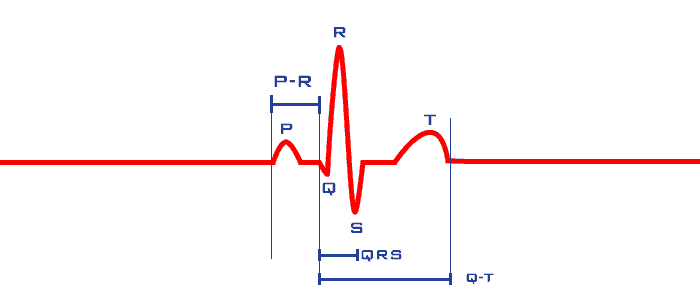
Since we are studying variability in timing of heart beats, it is obviously crucial that we have an means of identifying precisely when a heart beat occurs. The ECG signal (when collected using a Lead II electrode configuration) has a sharp and clearly detectable R peak which is typically used as the landmark from which to determine beat to beat timing. Everything you need to know regarding the ECG signal can be found here:
Respiration
Respiration is an important signal to collect if you plan to report RSA as an indicator of parasympathetic nervous system influence. It is not required to calculate RSA, but rather it is used to confirm the validity of the RSA value. We will discuss specifically how it is used in this way when we talk about RSA.
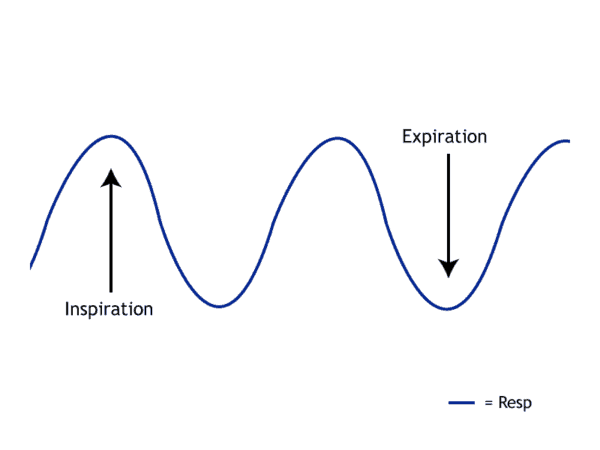
Respiration signals are roughly sinusoidal in shape, and consist of alternating cycles of inspiration (breathing in) and expiration (breathing out). It can be collected using a respiration belt or derived from one of the cardiac impedance signals. Deriving respiration from cardiac impedance is particularly powerful, because through study of both cardiac impedance and HRV you can get a picture of both sympathetic and parasympathetic influence. This provides a deeper understanding of autonomic nervous system regulation.
PLE
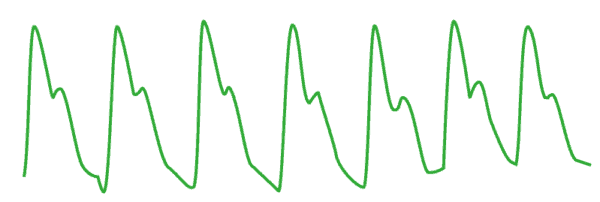
The plethysmograph (abbreviated PLE, or PPG) can be used as an alternative to ECG, as it also provides a means to determine beat to beat timing. It is typically collected using a sensor placed on the finger or ear, and uses light to illuminate the skin and detect changes in light absorption as blood moves through the body.
The rounded landmarks on the PLE signal can present a problem when trying to identify the precise time at which they occur. This can result in differences in peak placement on the order of milliseconds, and milliseconds matter when measuring HRV. It is therefore preferred, when possible, to use the ECG signal for HRV analysis.
Helpful Hints
- ECG (or PLE) is the only required signal for HRV analysis, but if you plan to report RSA be sure to have a source of respiration to validate your results
- Collecting cardiac impedance as your respiration source opens the possibility of a deeper understanding of autonomic balance
- Learn correct waveform morphology before collecting data to ensure your signals are good quality. This will save a ton of time during analysis
Next time we will talk about how the ECG signal is used to determine beat to beat timing and the so-called Time Domain HRV statistics.


