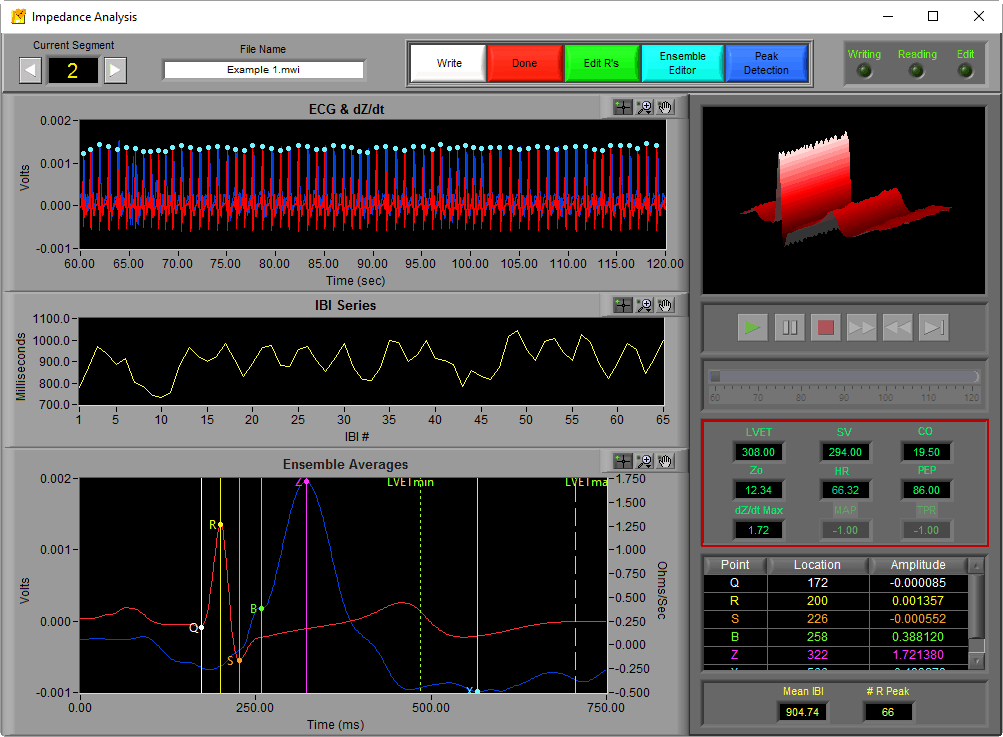
Welcome back to the series on Cardiac Impedance. This time, we will use the key points identified last time on the dZ/dt ensemble average to determine important systolic time intervals (PEP, LVET) which will lead directly into additional cardiac indices of interest (stroke volume, cardiac output, total peripheral resistance) calculated by the IMP analysis application. All of the statistics discussed can be found on the right hand side of the analysis screen above the ensemble points table.
Pre-Ejection Period (PEP)
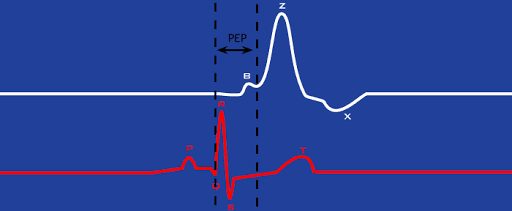
The pre-ejection period, or PEP, is the time interval from the Q point of ECG to the B point of dZ/dt. In other words, it is the interval from the start of electrical stimulation of the heart until the mechanical opening of the aortic valve.
Left Ventricular Ejection Period (LVET)
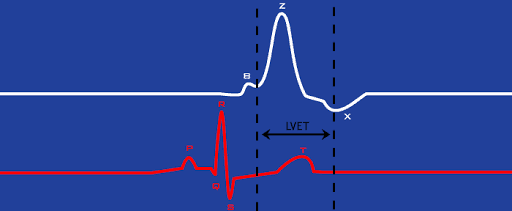
The left ventricular ejection period, or LVET, is the time interval from the B point to X point on dZ/dt. Physiologically this corresponds to the interval between the opening and closing of the aortic valve.
Stroke Volume
Stroke volume is a metric of the volume of blood pumped by the left ventricle each beat. It it typically measured in milliliters (ml). The IMP analysis application has three options for calculating stroke volume, some of which take into account certain physical properties of the human body.
Make sure your Zo and dZ/dt signals are properly scaled. If they aren’t scaled into ohms and ohm/sec, respectively, your Stoke Volume and Cardiac Output measures will be incorrect.
Kubicek
The Kubicek equation is one of the oldest accepted methods for determining stroke volume. It is as follows:
where
p = Blood resistivity constant (rho)
L = Distance between front SNS electrodes (in cm)
Zo = Average impedance (ohms)
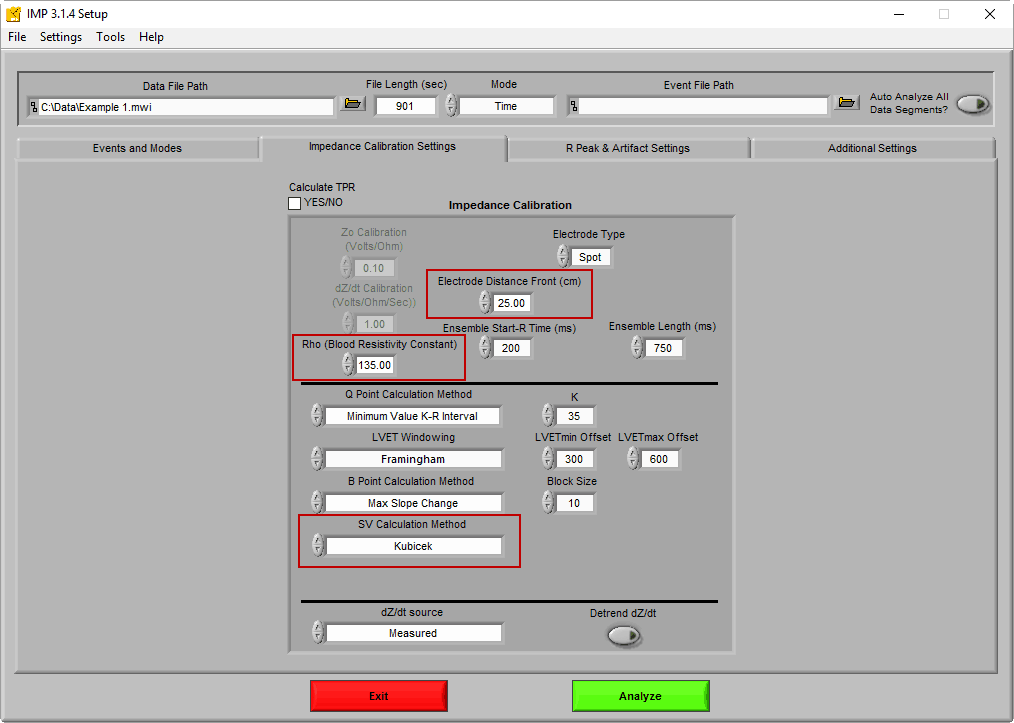
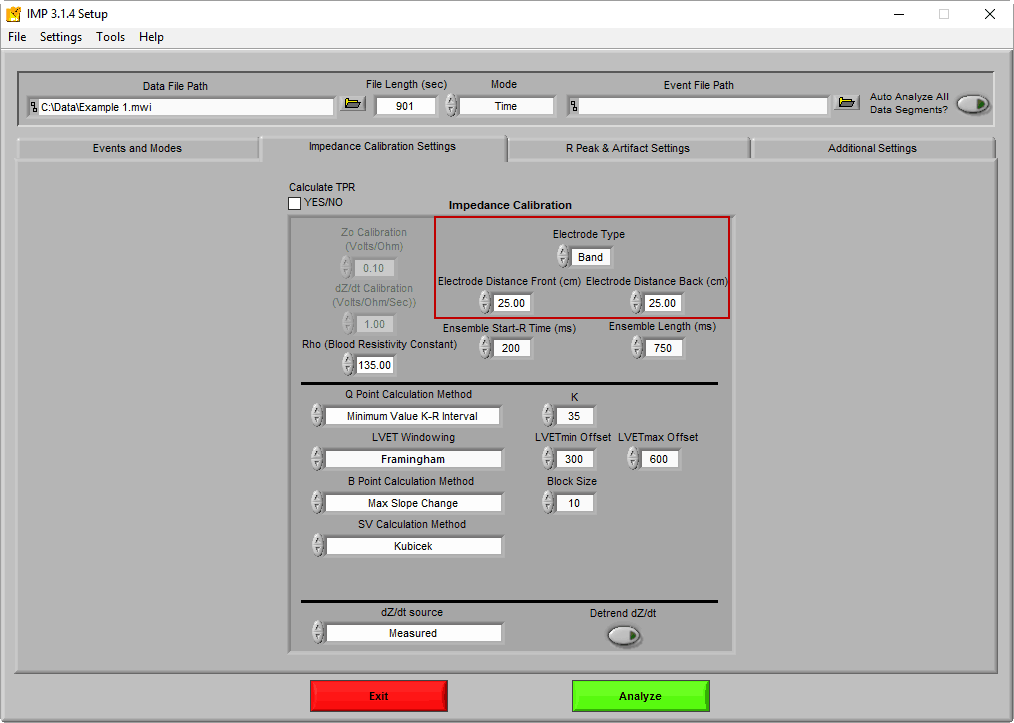
The blood resistivity constant and front electrode distance are defined on the Impedance Calibration Settings tab
If you are using spot electrodes, only the front electrode distance is required. If you are using band electrodes for impedance you will need to enter both the front and back distances, and the average of the two will be used as L in the equation.
Sramek-Bernstein
The Sramek-Bernstein method is a modification of the Sramek formula, which takes into account the physical size of the subject (height and weight). It also assumes the size of the chest is directly proportional to the height of the subject, thus not requiring measurement of the electrode distance:
where
Zo = Average impedance (ohms)
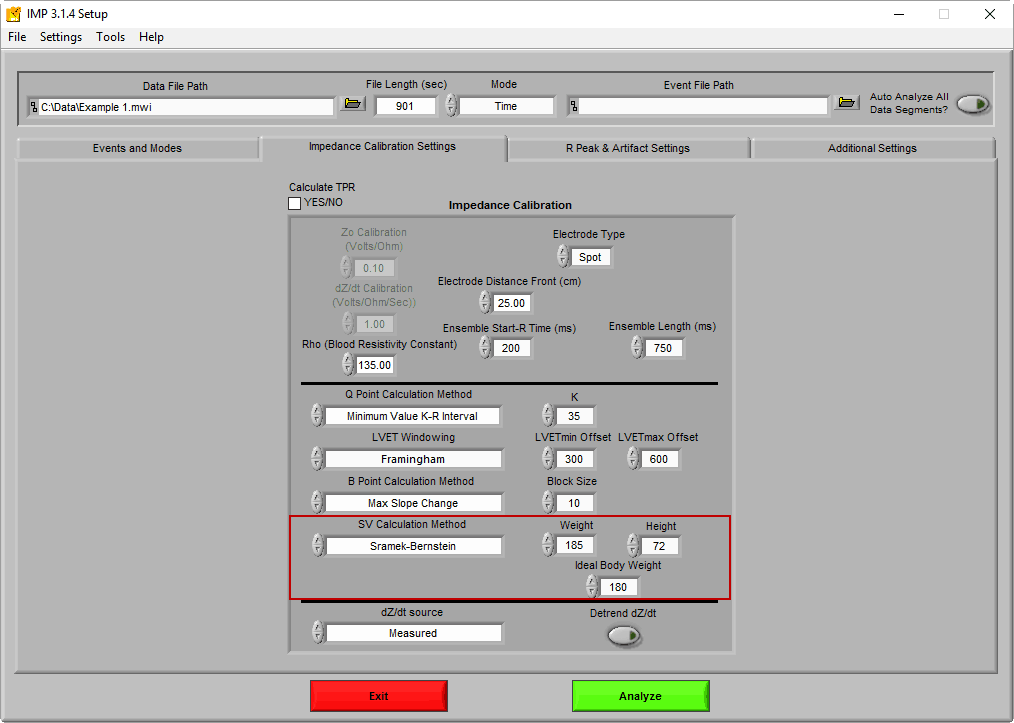
By changing the SV Calculation Method to Sramek Bernstein, fields for the height, weight, and ideal weight become available
Height is expressed in inches (in), and Weight and Ideal Weight are expressed in pounds (lbs). To dig deeper into this method, see this paper.
Bernstein-Lemmens
The Berstein-Lemmens variation, also known as N, utilizes an estimate of thoracic blood volume using the subject’s weight among other constants to determine stroke volume. See this paper for more information on how these terms are determined.
where
VITBV =Estimate of thoracic blood volume
Zeta = Index of transthoracic aberrant conduction
The only physical dimension needed for this equation is the subject’s weight.
Which method is the best?
All three of these approaches are based on different assumptions, so they can and will produce varying results. That being said, they have all been proven to reliably express stroke volume. Whichever method you choose, you should use it for the duration of your study.
Cardiac Output
Cardiac output (CO) is yet another representation of the volume of blood pumped by the heart, but by taking into consideration heart rate, it is indicative of blood flow over a certain time period. Typically cardiac output is described in liters per minute (L/min). It is defined simply as:
CO = SV x HR
Total Peripheral Resistance
Total peripheral resistance (TPR) quantifies the force required for blood flow in the vascular system. It is defined as
where
MAP = Mean Arterial Pressure
Mean arterial pressure is determined by analyzing a continuous blood pressure waveform. Blood pressure is required to calculate TPR. For more information on how this is done in the IMP application, see this article.
Next Time
Now we have covered the various statistics of interest when analyzing cardiac impedance and how these values are obtained. Next we will talk about editing techniques to ensure the correctness of these statistics using built in data editors in the IMP analysis application.

