There are several graph tools available in both BioLab and the analysis applications which allow you to manipulate the way data is viewed as well as any cursors on the graph (when applicable).
Main Tools Palette
The graph tools palette is generally attached or in close proximity to the graph which it affects, and looks like this:
![]()
The tools are selected by clicking on them with the left mouse button. There are 3 main tools available:
![]() Crosshair Tool: Used for cursor movement as well as inserting/deleting markers on the graph. The crosshair tool is automatically selected when inserting or deleting a point in the editor.
Crosshair Tool: Used for cursor movement as well as inserting/deleting markers on the graph. The crosshair tool is automatically selected when inserting or deleting a point in the editor.
Zoom Tools Palette
Used to adjust the zoom level, or amount of data shown on the graph. By clicking the Zoom Tools icon, a sub-menu will appear:
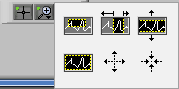
The tools are selected by clicking on them with the left mouse button. There are 6 types of zooms available: