Welcome to the third installation of the All About ECG series that is, as you might have guessed, an in-depth discussion on interpretation of the electrocardiogram, or ECG. We have gone through the basics in the first two blog posts, and now we can move on to a bit more interesting topic – artifact identification.
What is artifact?
In the world of data analysis, artifact is synonymous with error. It is an anomaly in the data set which affects the analysis and results and it must be dealt with to derive correct and meaningful statistics. When talking about artifact in HRV and IMP analysis (if you don’t know what HRV or IMP stand for, start here), we are talking about the incorrect placement of an R peak, the absence of an R peak, or a timing inconsistency introduced by a cardiac condition or arrhythmia. The presence of artifact in a data set can have a potentially huge effect on the resulting statistics. To put it in perspective, a single artifact can alter RSA (an index of heart rate variability) by more than 2 units!
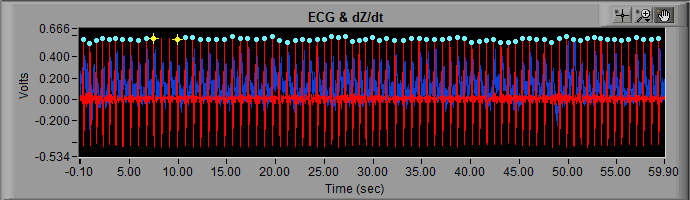
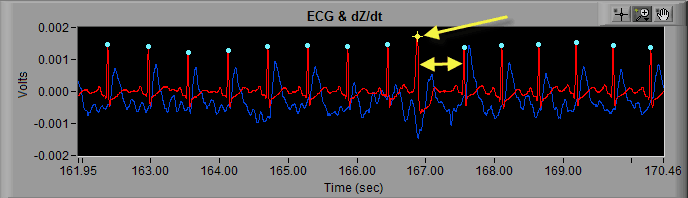
In the MindWare analysis applications, potentially erroneous beats are marked by a yellow star, whereas beats which are less likely to be artifact are marked with a blue dot.
The decision of whether a detected beat is marked blue or yellow falls to the dual artifact detection algorithms available in the analysis applications.
Artifact Detection
There are 2 algorithms which attempt to detect artifacts in the HRV and IMP applications: MAD/MED and IBI Min/Max. They are configurable on the R Peak and Artifact Detection settings tab on the Setup screen.
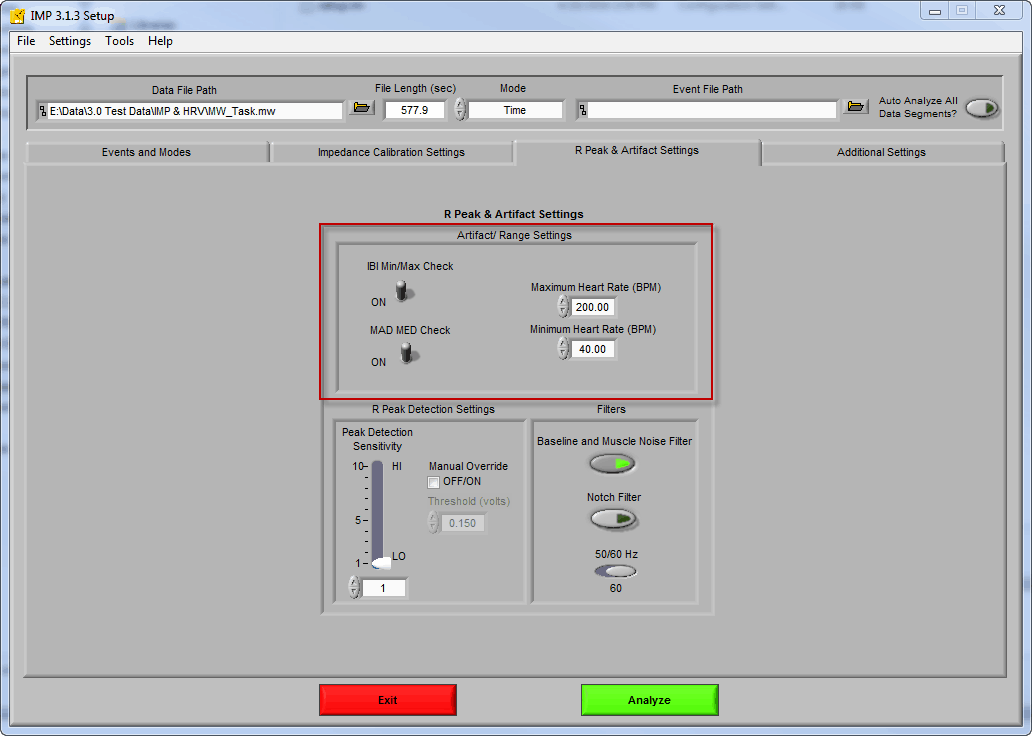
IBI Min/Max
The IBI Min/Max algorithm is very simple – if the inter-beat interval falls above or below the specified heart rate thresholds then the beat is flagged as potential artifact. As a reminder, the inter-beat interval is the time between subsequent R peaks. By default, these values are set to 40 and 200 BPM. Of course if you are studying subjects whose expected heart rate fall outside of this band, you will want to increase/decrease them as necessary.
MAD/MED
The MAD/MED artifact detection algorithm is a bit more complicated, and looks at the following 2 variables:
MAD – Minimum Artifact Deviation of artifactual beats which are greater than or equal to half of a normal IBI
MED – Maximum Expected Deviation of normal beats based on the distribution
Based on these 2 variables,
Artifact Criterion = (MAD + MED) / 2
The fine details for implementation of this algorithm can be found in this publication, but generally speaking, the MAD/MED algorithm looks at the variability of the inter-beat interval, and flags outliers as potential artifact.
Helpful Hints
- Artifact is bad, and we need to fix it to avoid skewing our results
- R peaks are marked with yellow stars because they are potentially artifacts, as determined by the built-in artifact detection algorithms
- You have the option to disable both of the artifact detection algorithms – but you shouldn’t unless you have a very good reason for doing so. If your data is good, you shouldn’t need to adjust anything besides the IBI Min/Max thresholds.
What next?
Now that we have identified artifact, and we know that we don’t want to keep it in our data set, what do we do? The MindWare analysis applications feature a graphical data editor, in which we can adjust the location of the identified R peaks to remove artifact and prevent it from corrupting our results. In the next entry, I will show you some examples of simple artifact editing using the ECG editor.