This article demonstrates how to detect Electromagnetic Interference (EMI) and apply suitable filters to eliminate unwanted noise from previously recorded physiological data.
Classifying Electromagnetic Interference
There are two main types of EMI which are Conducted and Radiated. Conducted EMI travels through conductors like wires or power lines while Radiated EMI propagates through the air without needing a conductor.
Common Sources of Electromagnetic Interference
Within each main type of EMI, the sources can be broken down into Natural and Human-Made.
Natural sources of EMI encompass a wide range of environmental phenomena, such as lightning strikes, solar flares, cosmic noise, static electricity, atmospheric electrical storms, solar magnetic storms, dust storms, snowstorms, and solar radiation.
Human-Made sources of EMI include a diverse array of technological and electrical sources, such as Alternating Current (AC) hum from the power grid, Wi-Fi and Bluetooth devices, lighting systems, electric motors, television broadcasts, radio signals, medical equipment, transmitters, transformers, inverters, microprocessors, and microwaves.
Most Prevalent Source of EMI in Physiological Data Collection
Alternating Current (AC)
This type of noise originates from the power grid and creates 50/60 hertz (Hz) & 100/120 Hz noise, also known as mains hum or an electrical hum. In North America, the power grid alternates current 60 times per second or at 60Hz. Everywhere else the power grid alternates at 50Hz. For our purposes, 50/60Hz noise typically originates from AC electromagnetic fields from nearby appliances and wiring. Additional harmonics above 100/120 Hz will be caused by the non-linear behavior of most common magnetic materials.
Conducted EMI is the most common form of EMI that we observe in the ECG/EKG, ICG/IMP, and EMG signals. This is typically observed when a participant is touching an electrical cable or device that is plugged into the AC outlet.
Note: It’s possible to observe 50/60Hz noise when the MindWare Mobile device is collecting data and charging at the same time. For this reason, it is not ideal to charge the Mobile during data collection, but there is an effective filter available for this common type of interference.
It is common for universities and hospitals to have research and medical equipment that creates radiated EMI so the interference may always exist at your data collection site.
Shared Impedance Frequencies
The other major source of hum is shared impedances; when a current is flowing through a conductor (a ground trace) that a small-signal device is also connected to.
In some cases where two or more participants are touching each other, the Impedance Cardiography (ICG/IMP) signal can be affected by shared impedance frequencies in which the conductor is the body. Typically this type of interference is centered around 100 Kilohertz (kHz).
Note: Shared impedance frequency interference is going to first appear around 100 Kilohertz (kHz) which is 100,000 Hertz (Hz) so please pay attention to the frequency unit as 100 Hz can sometimes be confused with 100 kHz.
Follow the instructions below to detect the frequency of any interference in your ICG/IMP waveforms. If you identify interference in your ICG/IMP waveforms around 100 kHz, please contact our support team.
Additional Sources of Noise
Conducted and radiated sources of EMI are diverse and include elevators, Wi-Fi and Bluetooth devices (such as laptops, cell phones, and wireless routers/access points), lights, electric motors and generators, television transmissions, radio and satellite signals, medical and research equipment, transmitters, transformers, inverters, microprocessors, and microwaves.
Detecting EMI In Your Data File
This video will provide a comprehensive tutorial on detecting and filtering EMI. For a step-by-step tutorial on identifying and filtering EMI, you may also follow the steps below the video.
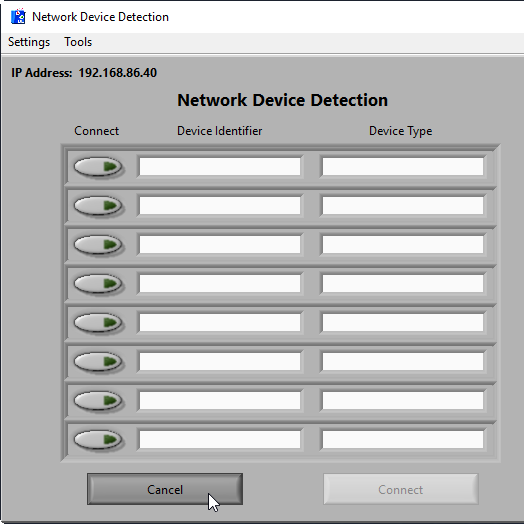
Step #1 – Open BioLab
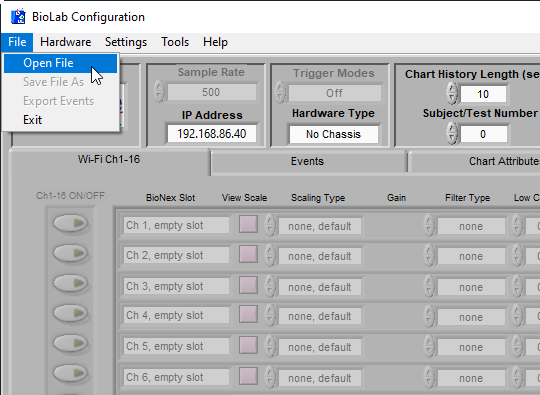
Click Cancel if greeted by the Network Device Detection Window or Open File if the BioLab window appears.

Step #2 – Open a File and View Waveforms
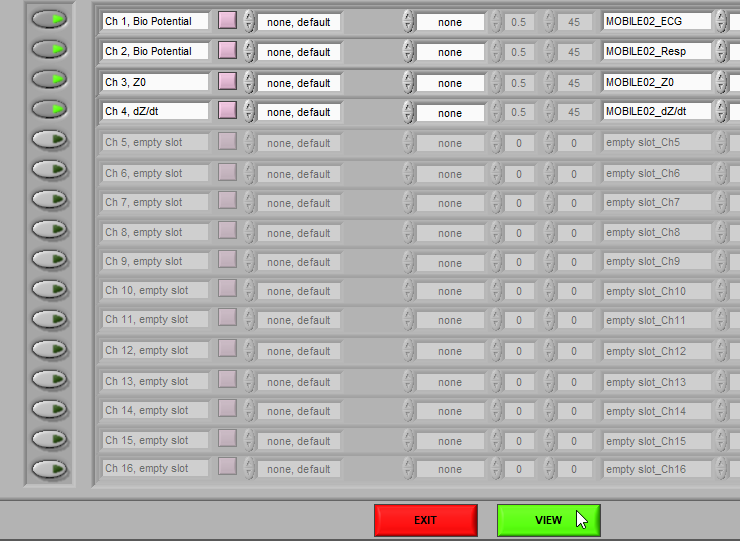
Step #3 – Static Analysis and Frequency Domain
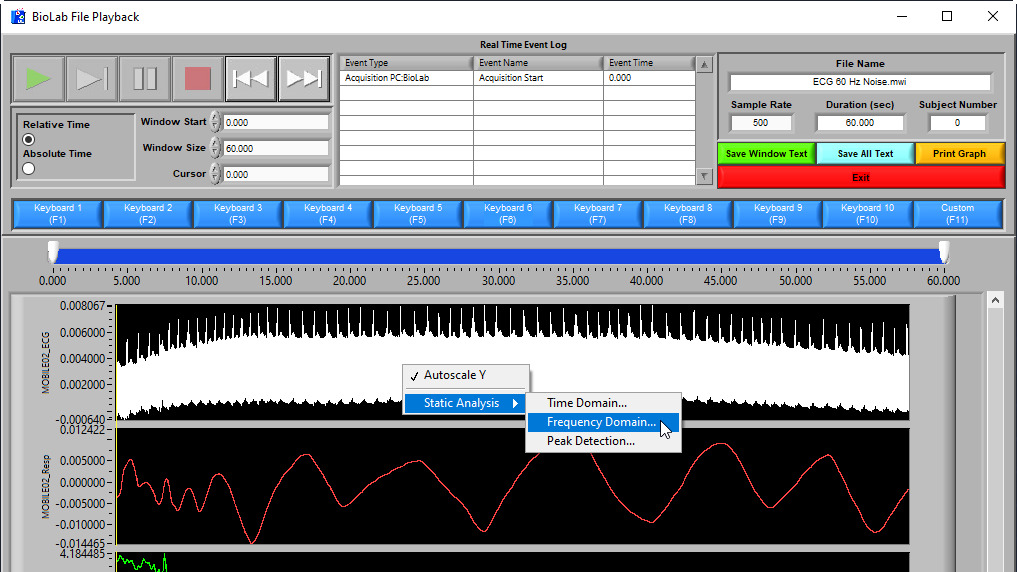
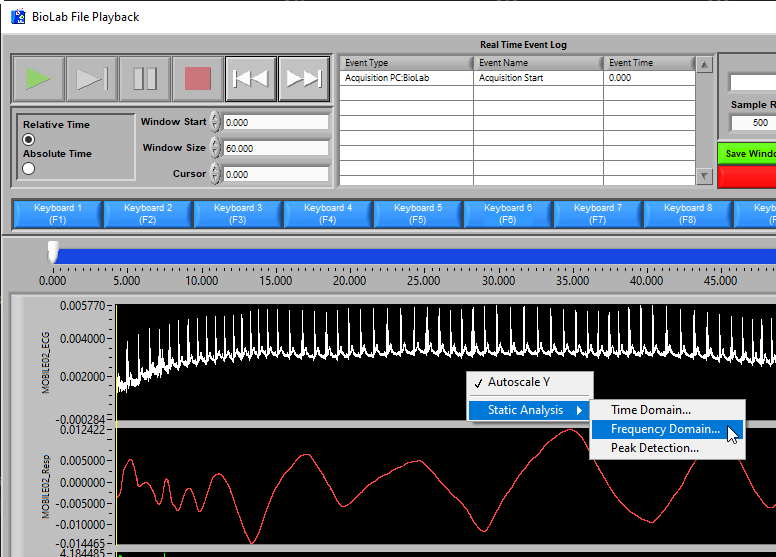
Right click on the waveform that you wish to inspect for EMI. Select Static Analysis and then Frequency Domain.
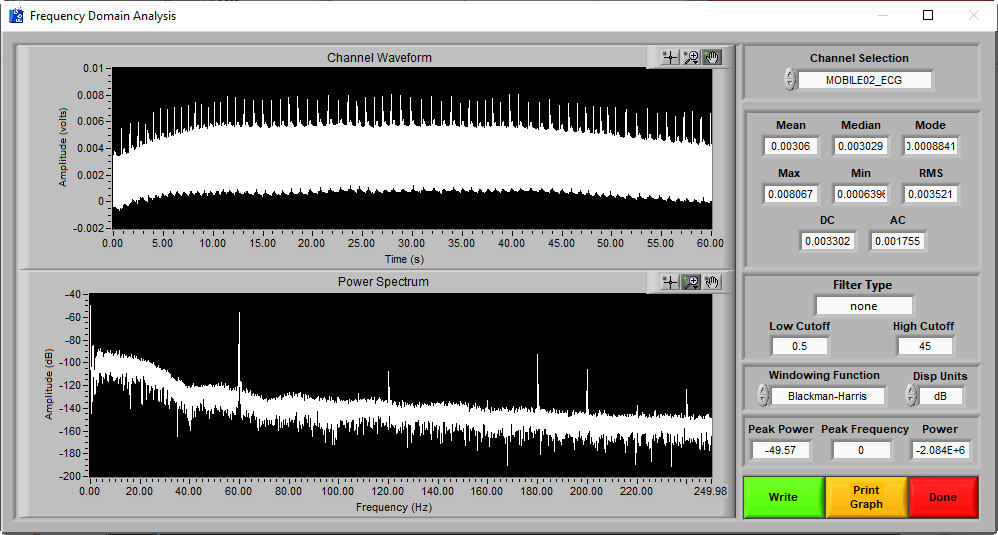
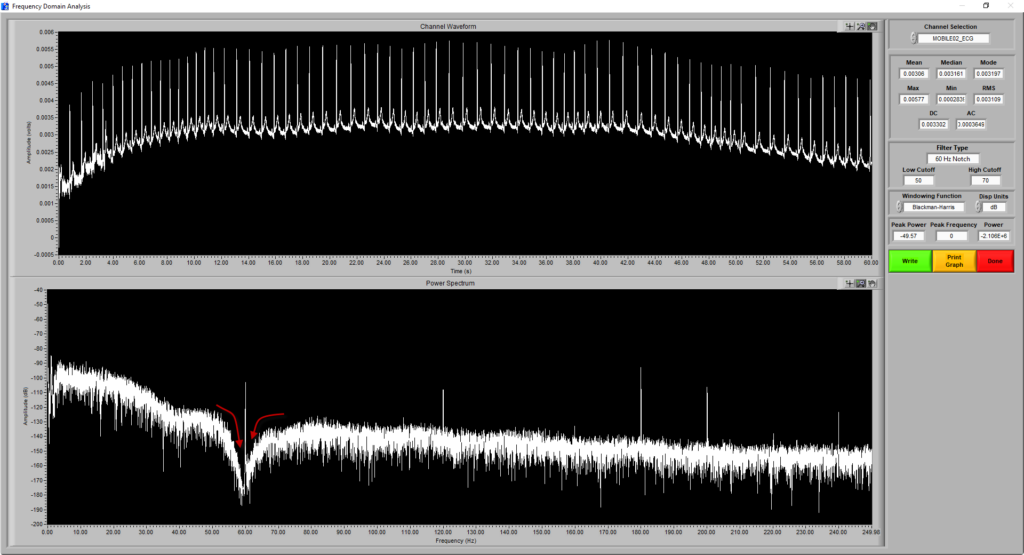
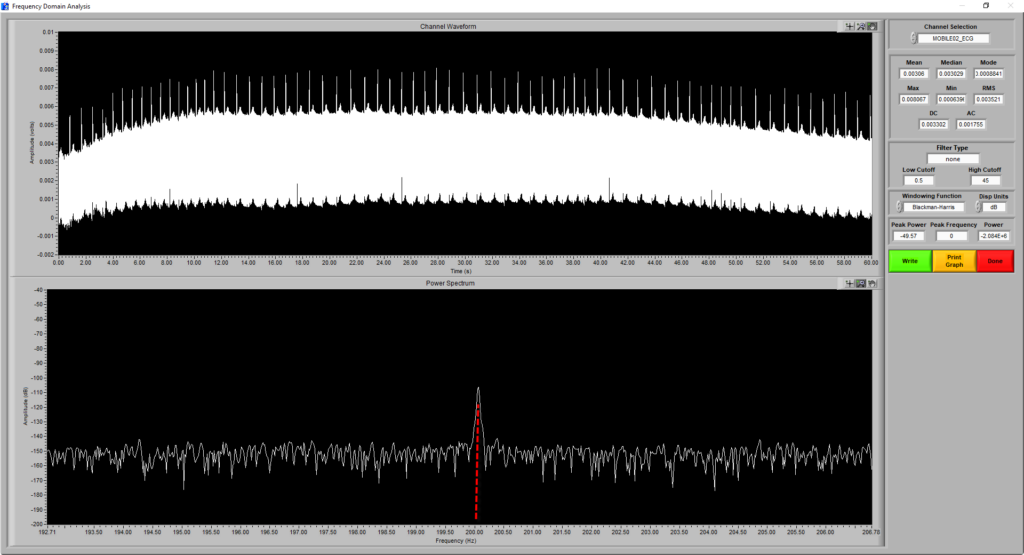
The Frequency Domain Analysis window will show data in a time series graph, “Channel Waveform” at the top of the screen, and the frequency splatter of the time series data within the “Power Spectrum” graph at the bottom.
Step #4 – Static Analysis and Frequency Domain
There can be multiple spikes across the frequency spectrum. This is due to the properties of electrical harmonics in which a source or fundamental current is being repeated throughout the frequency spectrum. For example, if we observe spikes at 60, 120, 180, and 240 Hz, the source for the spikes at 120, 180, and 240 Hz, is likely the initial spike that occurs at 60 Hz.

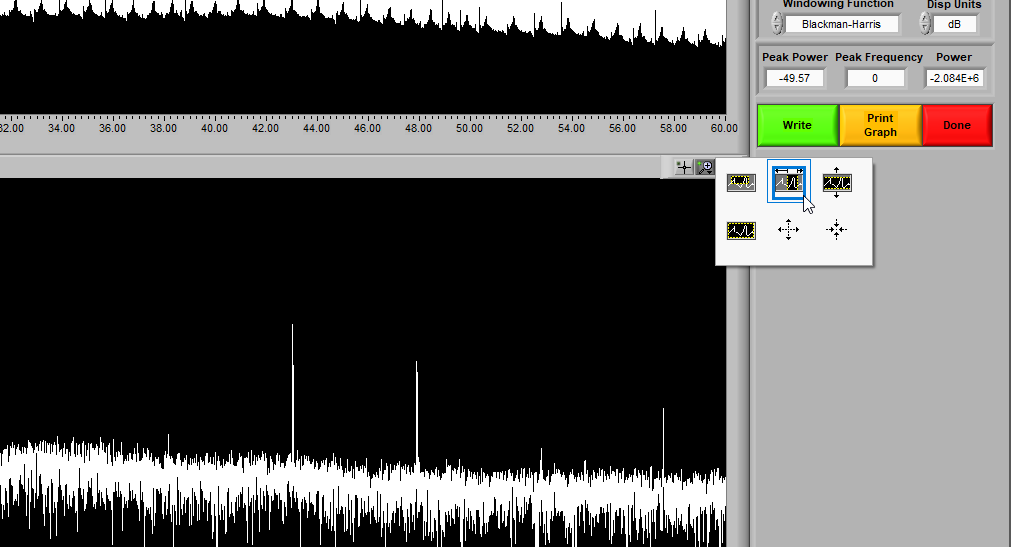
Use the second zoom button to click, drag, and release a window around the first major spike at the lowest frequency.
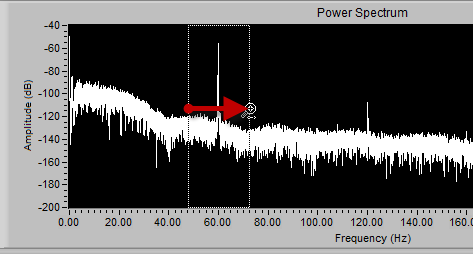
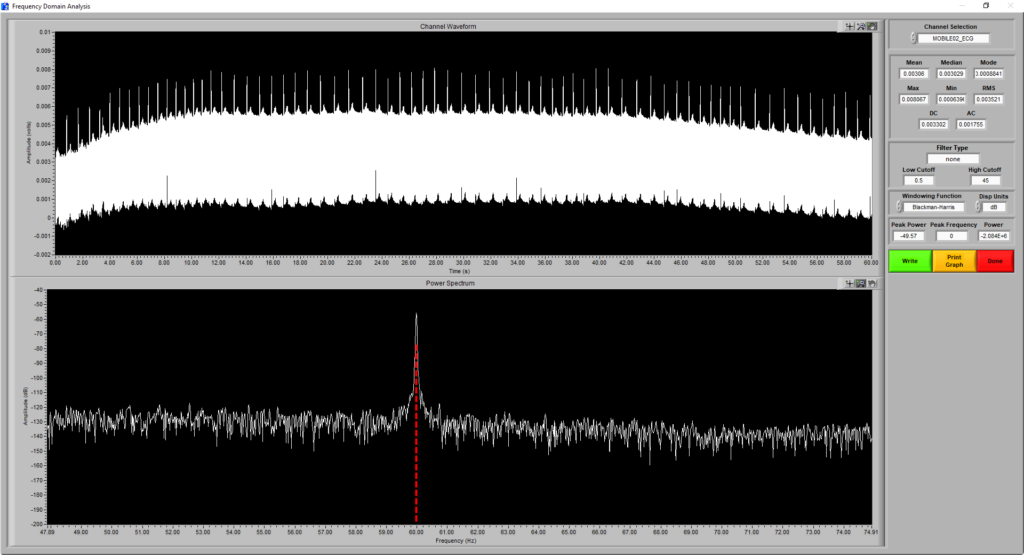
Once the center point of the fundamental interference has been properly identified, you may click the red Done button at the right hand side of the screen. Then, click the red Exit button on the BioLab File Playback window which will return you to the main BioLab Configuration screen.
Step #5 – Applying a Standard Filter
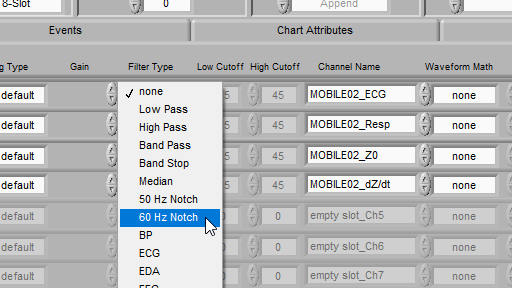
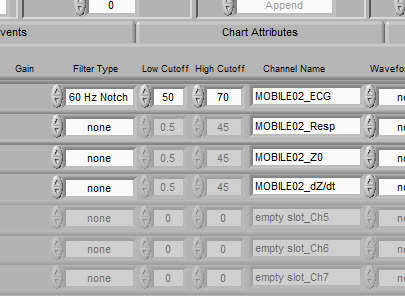
Click into the Filter Type window associated with the waveform you wish to apply a filter to. In this case, the source interference spike occurred at 60 Hz which is common frequency of interference in North America so a standard filter is available (60 Hz Notch). If you are observing data collected in the rest of the world, you will likely want to apply the 50 Hz Notch filter.
Once the 60 Hz Notch filter is selected, you will notice that a Low Cutoff of 50 Hz and a High Cutoff of 70 Hz have applied. Normally, it is best practice to begin and end the tapering of a filter +/- 10 Hz from the center point of the interference spike.
Step #6 – Verifying the Filter Implementation
Select the green View button at the bottom of the BioLab Configuration screen. Once the BioLab File Playback window appears, right click on the waveform you applied a filter to and select Static Analysis–Frequency Domain options just as you did in Step 3.
You should now see that the area around the source interference spike has been tapered by the filter that was just applied.
The fundamental interference will likely remain within the Power Spectrum graph, but it’s influence on the time series data within the top Channel Waveform chart has been dramatically reduced as we no longer see the thick band of interference.
Note: In many cases, filtering out the fundamental (leftmost) peak will dampen the affects of the higher frequency spikes. You will usually only need to apply a filter at the source interference spike for further analysis, even if the subsequent spikes remain.
Non-standard Source Interference Frequencies
If you observe source interference at a frequency that does not have a standard BioLab filter, follow Steps #3 and #4 to identify the non-standard source frequency.
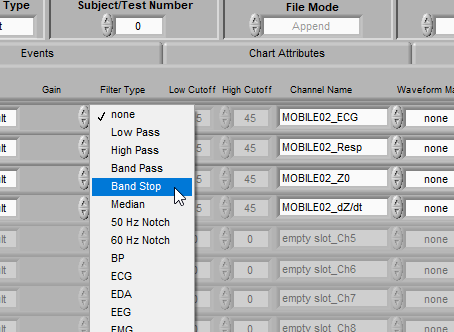
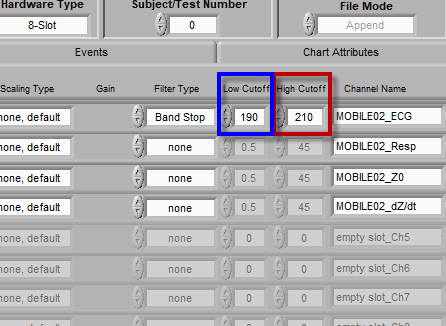
Return to the main BioLab configuration screen and select the Band Stop Filter Type. First, enter a High Cutoff value (red box) that is 10 Hz above the center point of interference. Then, put a Low Cutoff value (blue box) that is 10 Hz below the center point of interference.
Return to the Frequency Domain Analysis window to ensure the filter was properly applied. Once again, you may notice that the interference has not been completely removed, but the tapering depth (purple dashed line) should encapsulate the majority of the spike as seen below.

Step #6 – Save the New File
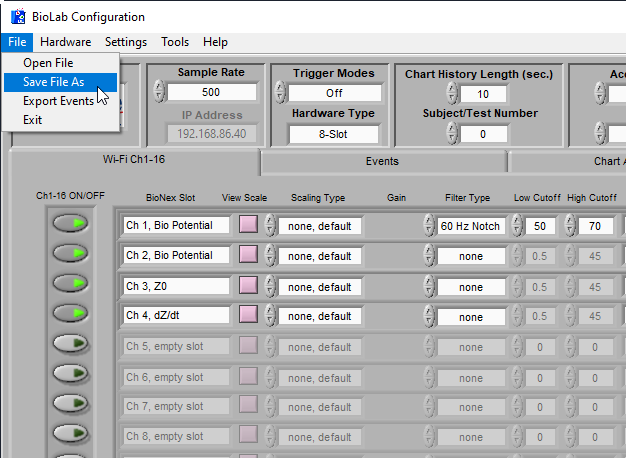
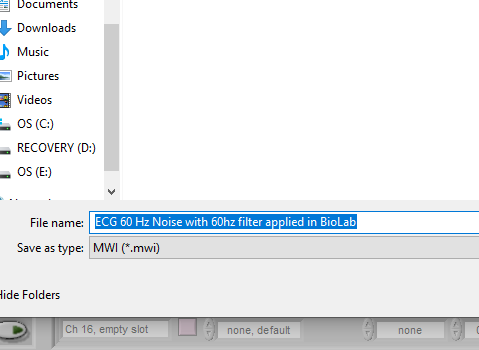
Return to the main BioLab Configuration screen and save the file with a descriptive title.
Step #7 – Loading Filtered Files for Analysis
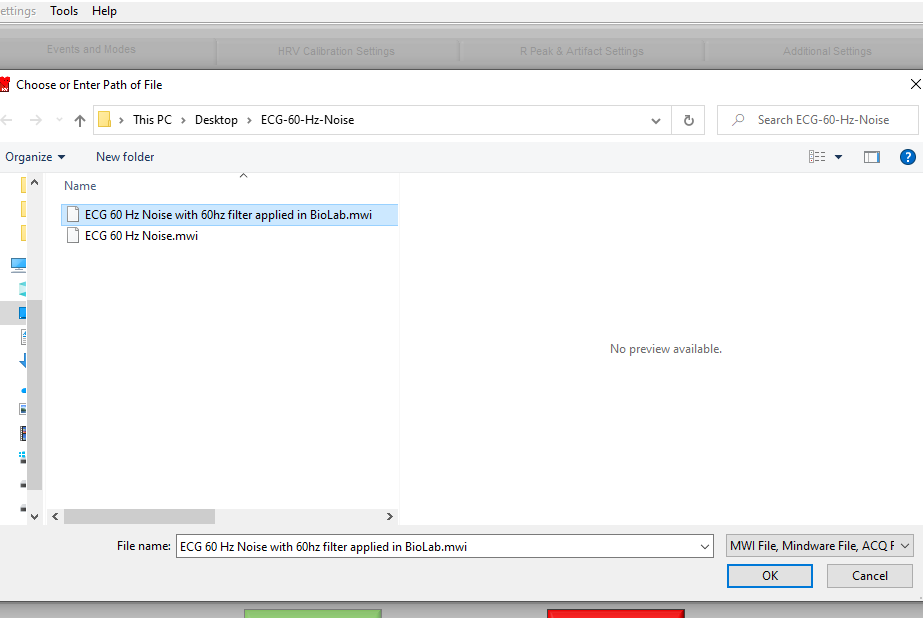
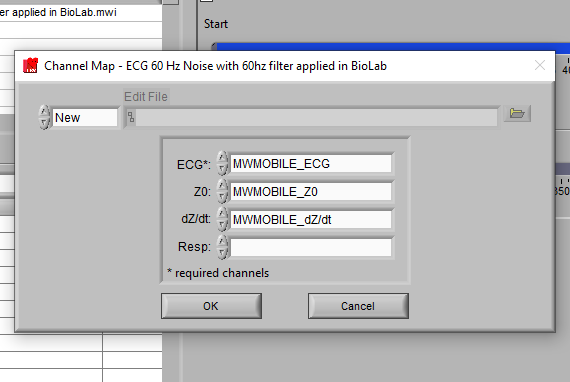
Open an analysis application, select the filtered file, and map the relevant waveforms to each channel.
Step #8 – Verify and Enable BioLab Filters
Navigate to the File menu and select BioLab Filters…
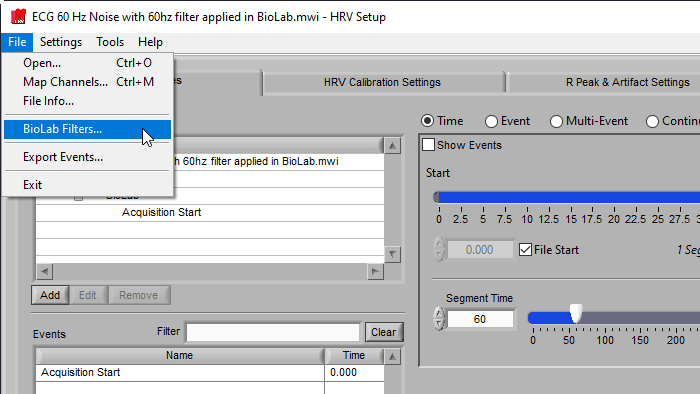
Verify all filters are correct (blue box) and click the Use BioLab Filters button.

Note: If Step #8 is not completed, any filters applied in BioLab will not be implemented for analysis.
Analysis Filters
Oftentimes a potential interference is only observed once a file has been loaded into an analysis application as seen below.
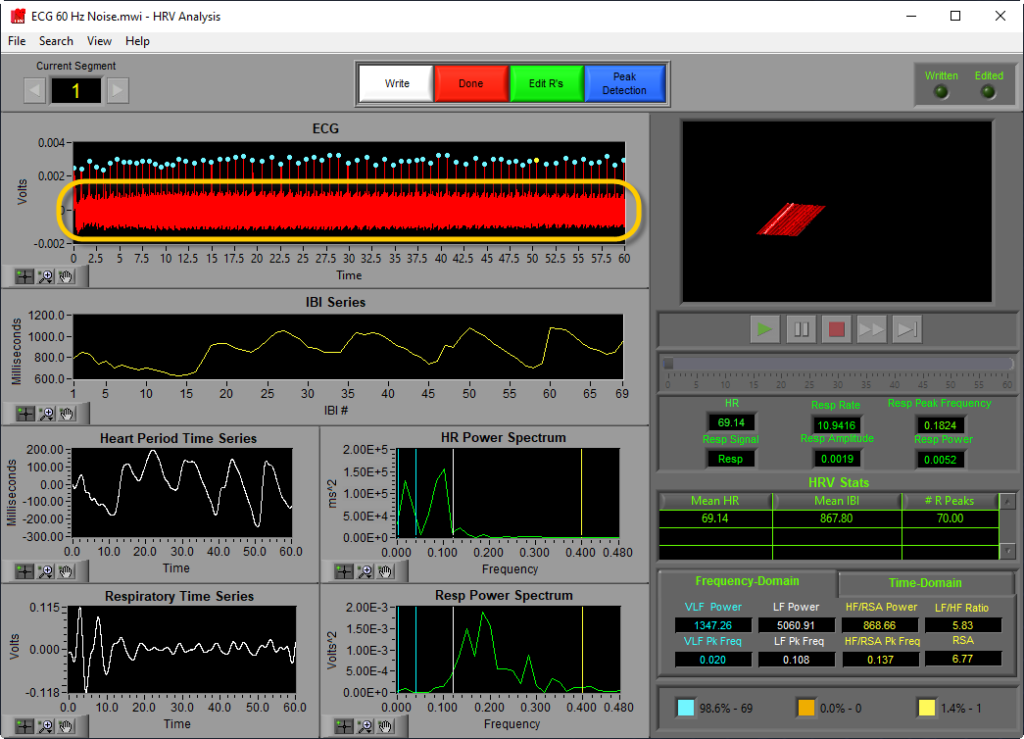
If this occurs, a time saving step can be taken to quickly apply a common filter such as 50 or 60 Hz directly within the analysis application.
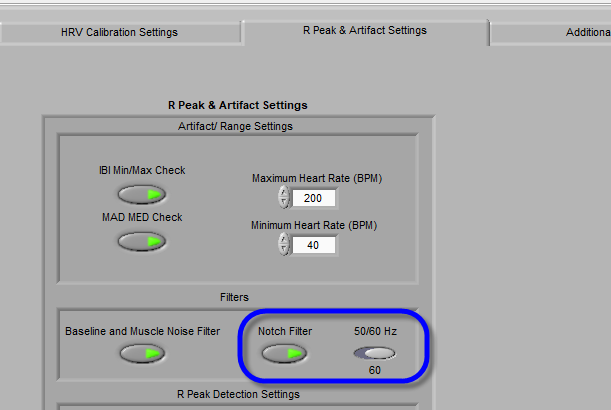
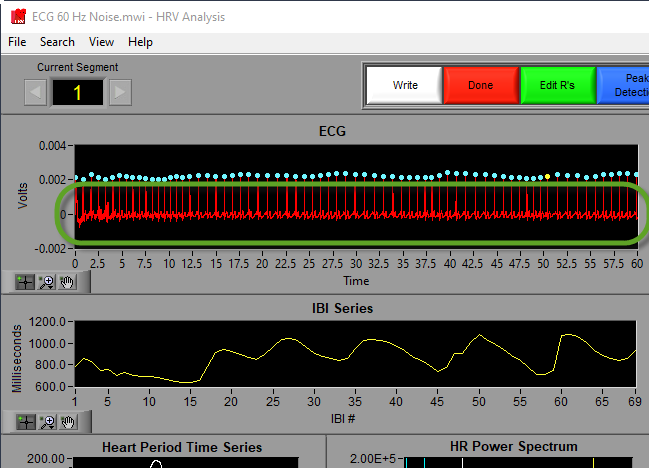
Exit the Analysis window by clicking the red Done button at the top of the screen. Open the R Peak & Artifact Settings or Calibration Settings tab and turn on the Notch Filter. Ensure that the 50 or 60 Hz toggle button is in the correct position. Finally, return to the Analysis window and verify that the analysis filter correctly removed the interference.
Signals and Noise
Electrocardiography (ECG/EKG) & Electromyography EMG with 50/60Hz Noise
As stated above, the most common type of EMI that we observe is of the conducted variety originating from AC. This type of noise commonly affects the ECG/EKG and EMG waveforms. For further instruction on how to remove this noise from your data, please refer to the MindWare support article “ECG 60Hz Noise Demo Data”.
Impedance Cardiography (ICG) with Shared Impedance Noise
Revisiting an earlier text, In some cases where two or more participants are touching each other, the Impedance Cardiography (ICG) signal can be affected by shared impedances in which the conductor is the body.
If your protocol involves participants touching each other and you believe that you are observing noise in the Zo and Dz/dt waveforms, please reach out to us or directly create a support case here so that we can help. In most cases, we will request that you send us one or more of your Mobile devices so that we may offset the constant current such that its frequency does not interfere with the other Mobile/s.
