Select analysis version to view the applicable content:
When cleaning an ECG signal, occasionally you will need to insert an R peak which was not identified by the analysis application. This article shows how to use the ECG editor to manually insert an R peak.
First, open the ECG Editor by pressing the green Edit R’s button on the Analysis screen:
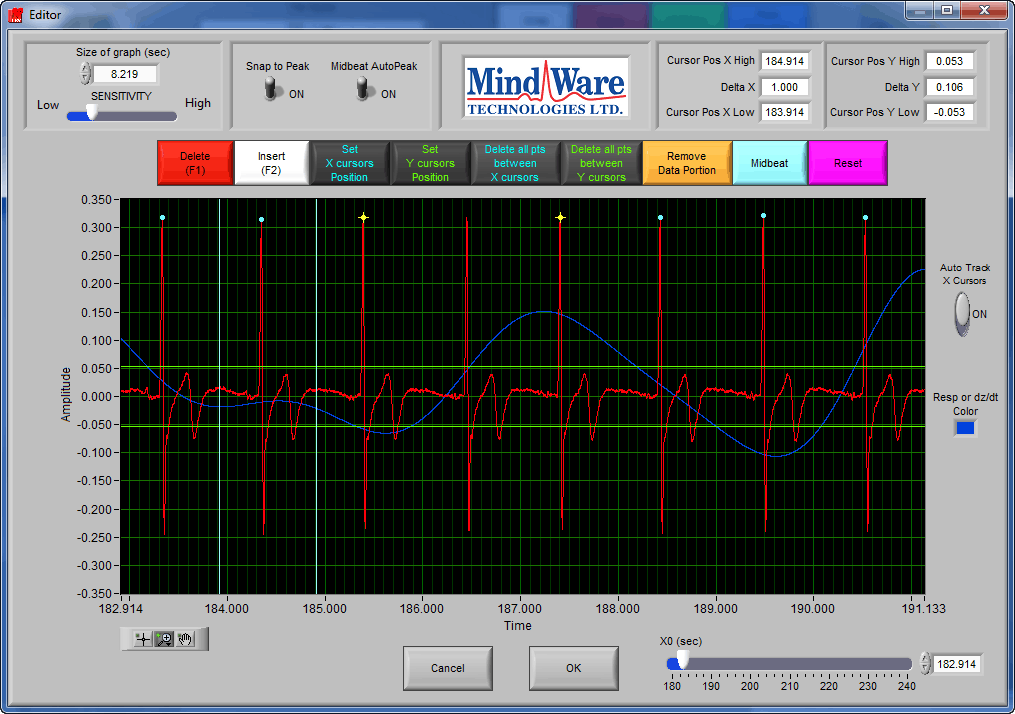
Once the editor has launched, locate the section of the signal where you would like to insert a peak. It can be helpful to zoom into that section to see it more clearly.
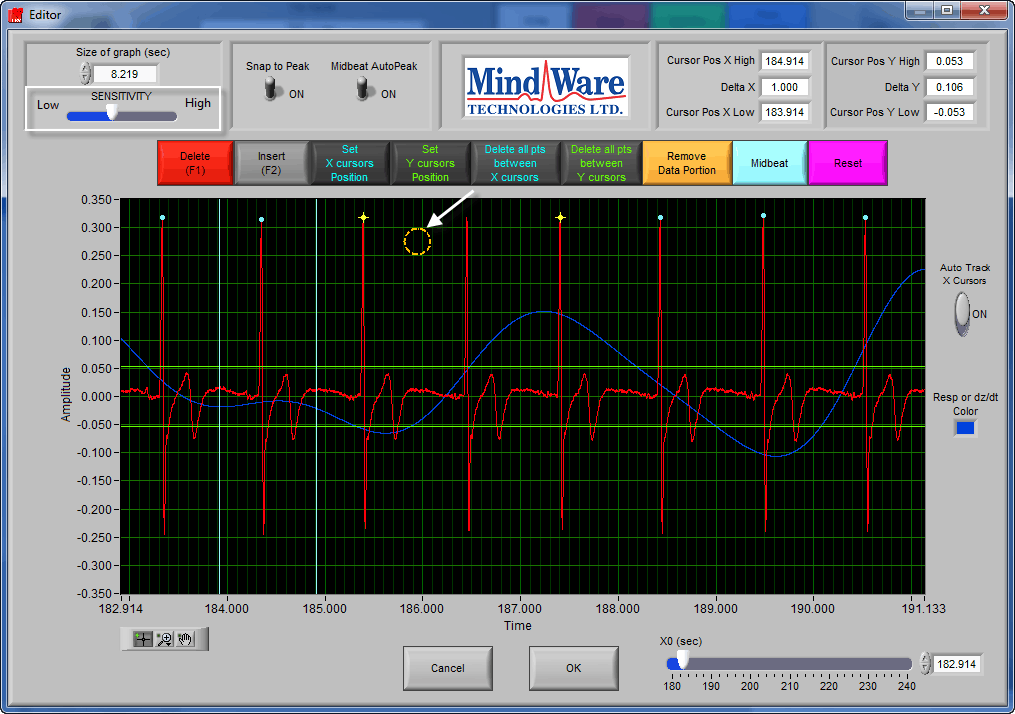
By clicking the white Insert button (or F2 on the keyboard) your cursor will change from the cross-hair icon to an orange circle.
This circle represents the region of the graph in which you want to mark an R peak. Using the scroll wheel on the mouse will expand or contract this orange circle, allowing you to insert R peaks with more precision when necessary. When no scroll wheel is available, directly adjust the Sensitivity slider in the upper left-hand corner of the editor window.
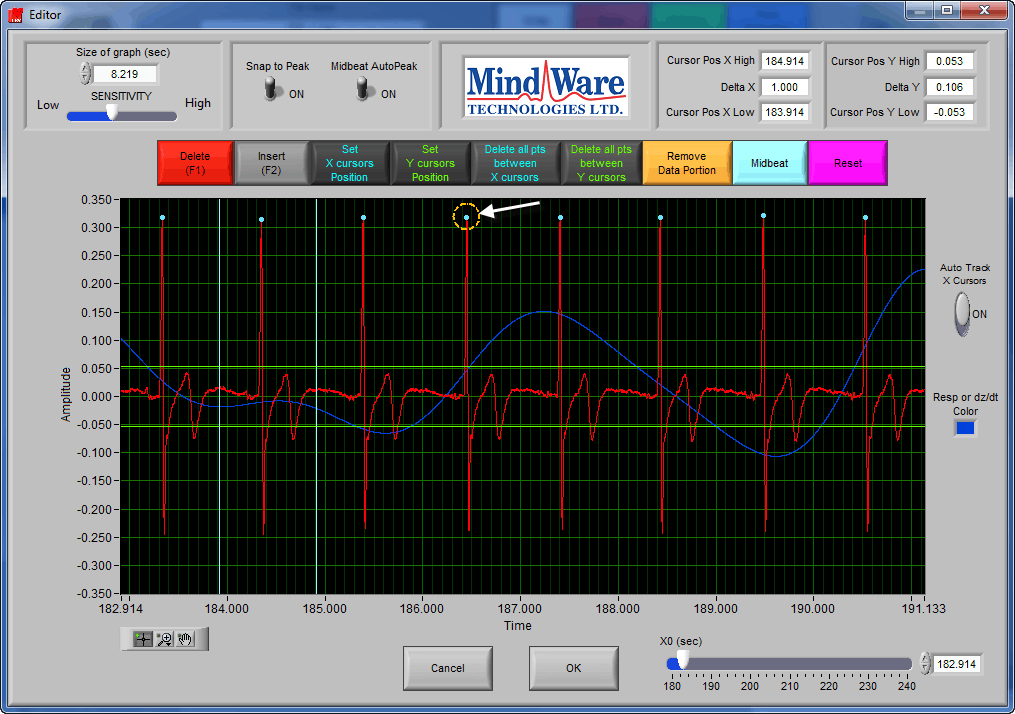
With the Insert tool enabled, move your cursor so that the part of the signal you want to mark as an R peak falls within the orange circle. Click the left mouse button to insert the R peak marker on the selected peak.
Note that the Insert tool will remain active until purposely deselected, or a different tool is selected. Be aware of this so you do not accidentally insert more peaks.
Press OK to save the changes in the editor and return to the analysis screen.
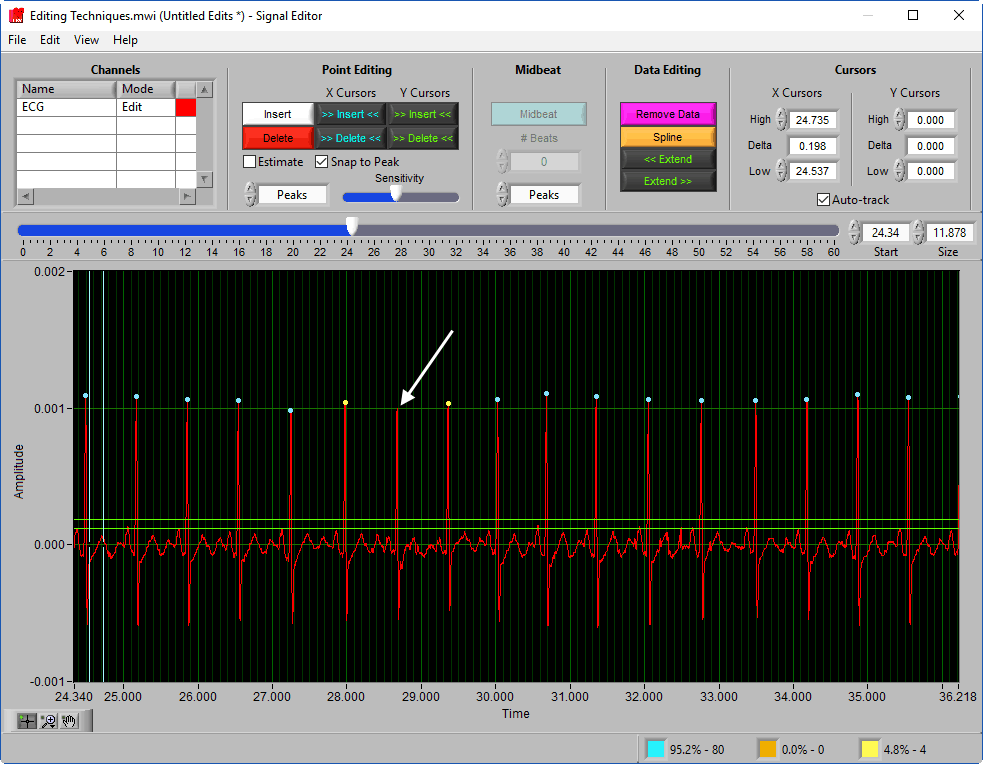
Once the editor has launched, locate the section of the signal where you would like to insert a peak. It can be helpful to zoom into that section to see it more clearly.
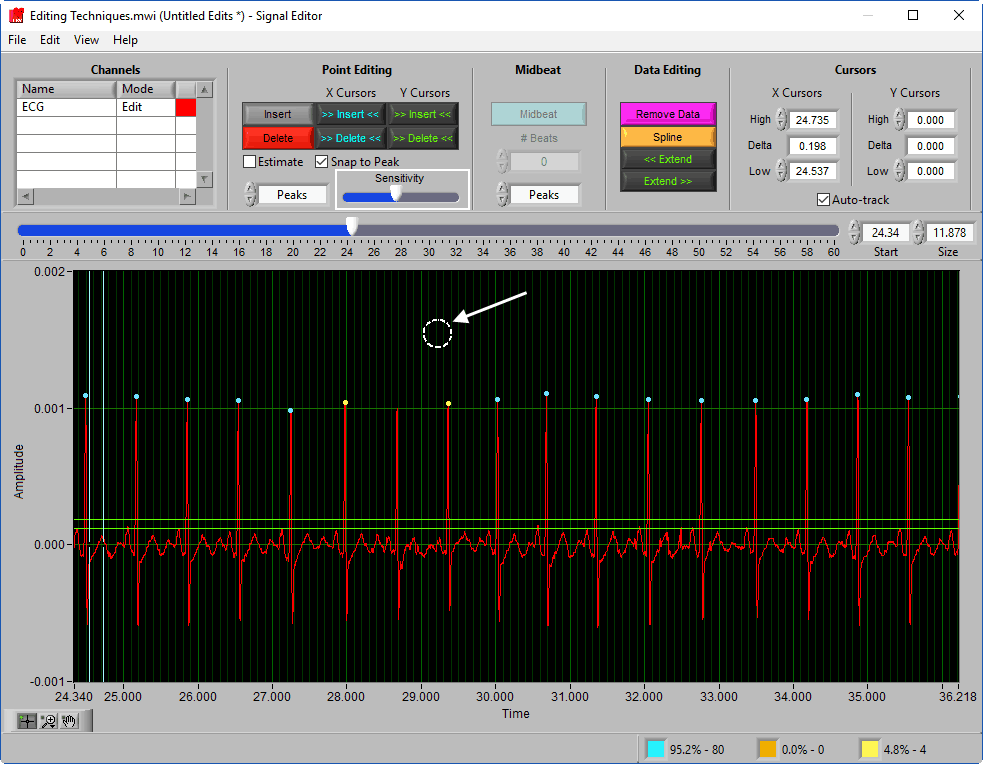
By clicking the white Insert button (or I on the keyboard) your cursor will change from the cross-hair icon to a white circle.
This circle represents the region of the graph in which you want to mark an R peak. Using the scroll wheel on the mouse will expand or contract this white circle, allowing you to insert R peaks with more precision when necessary. When no scroll wheel is available, directly adjust the Sensitivity slider in the Point Editing section of the toolbar.
With the Insert tool enabled, move your cursor so that the part of the signal you want to mark as an R peak falls within the white circle. Click the left mouse button to insert the R peak marker on the selected peak.
Note that the Insert tool will remain active until purposely deselected, or a different tool is selected. Be aware of this so you do not accidentally insert more peaks.
Press OK to save the changes in the editor and return to the analysis screen.

