Select analysis version to view the applicable content:
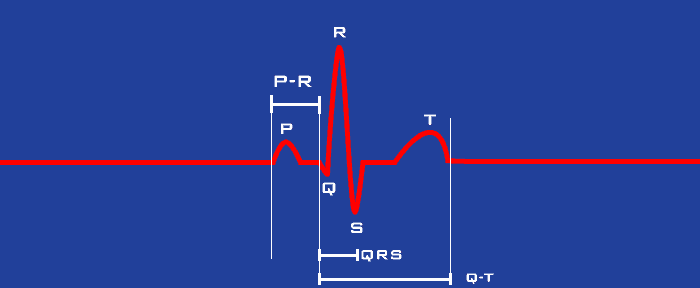
Welcome back to our blog series on analyzing the electrocardiogram, or ECG. Recall from last time the typical morphology of the ECG cycle:
Today we are going to talk about how the MindWare applications identify two key components of the ECG waveform – the R peak and the Q point.
R Peak Identification
The R peak is the single most important component of the ECG waveform to identify when analyzing for heart rate variability (HRV) and impedance cardiography (IMP). Thankfully the R peak is the most easily identifiable component of the ECG signal due to its sharp rise and amplitude in comparison to the rest of the signal. The pronounced nature of the R peak is due to the recommended Lead-II electrode configuration.
The MindWare HRV and IMP analysis applications will automatically scan the ECG waveform and identify what they perceive to be R peaks. The identified R peaks are then marked with either blue dots or yellow stars, with the blue dots signifying “good” R peaks and the yellow stars marking potential artifact or error (which we will talk more about next time).
There are 2 ways in which the analysis apps search for R peaks – Dynamic Peak Detection and Manual Override.
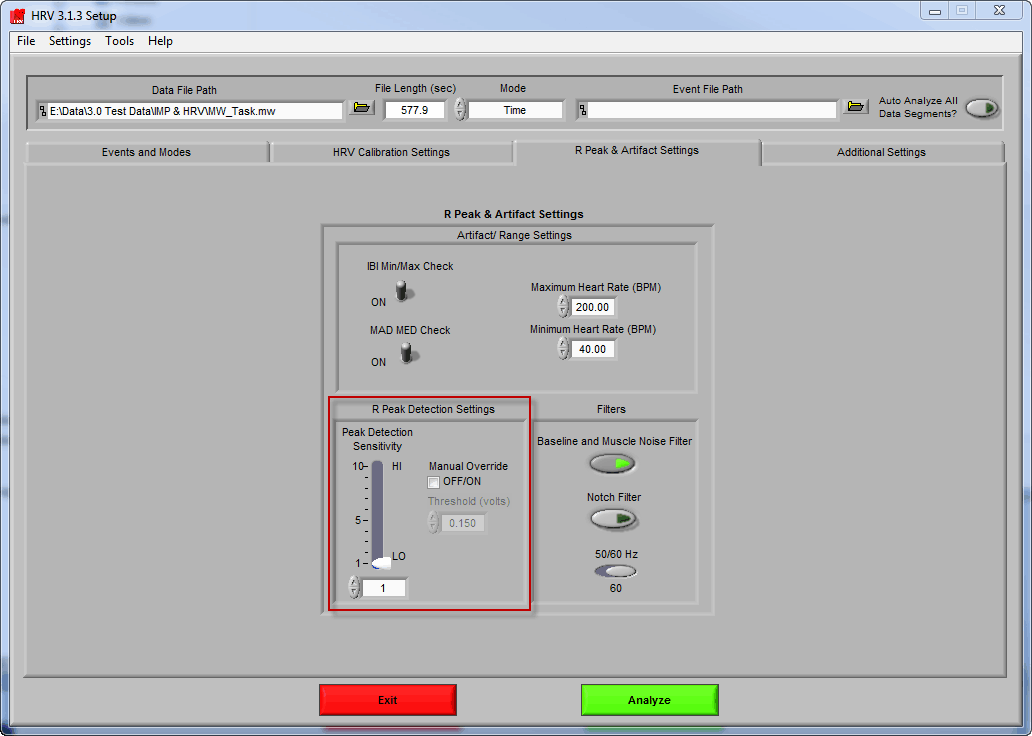
Dynamic peak detection is enabled by default and uses known characteristics of an R peak to identify portions of the signal as an R peak. It takes into account the amplitude of the peak relative to the signal around it, the slope of the signal as it rises to the peak, and the proximity of the peak to those which have been identified around it. There is a sensitivity control, which loosens the strictness of these criteria when increased, and tightens them when decreased.
Manual Override removes the template-matching algorithm and simply looks for any peak which falls above the specified voltage threshold. This peak detection method is used less often but is great for specific situations.
By default, the application will automatically detect R peaks using the Shannon Energy Envelope technique which has been shown to be highly successful even in difficult situations such as motion artifact and abnormal morphology. If you have a particularly abnormal ECG series, or you are using a different signal to study HRV (such as plethysmography), you may want to instead use an absolute threshold peak detector by enabling Manual Override.
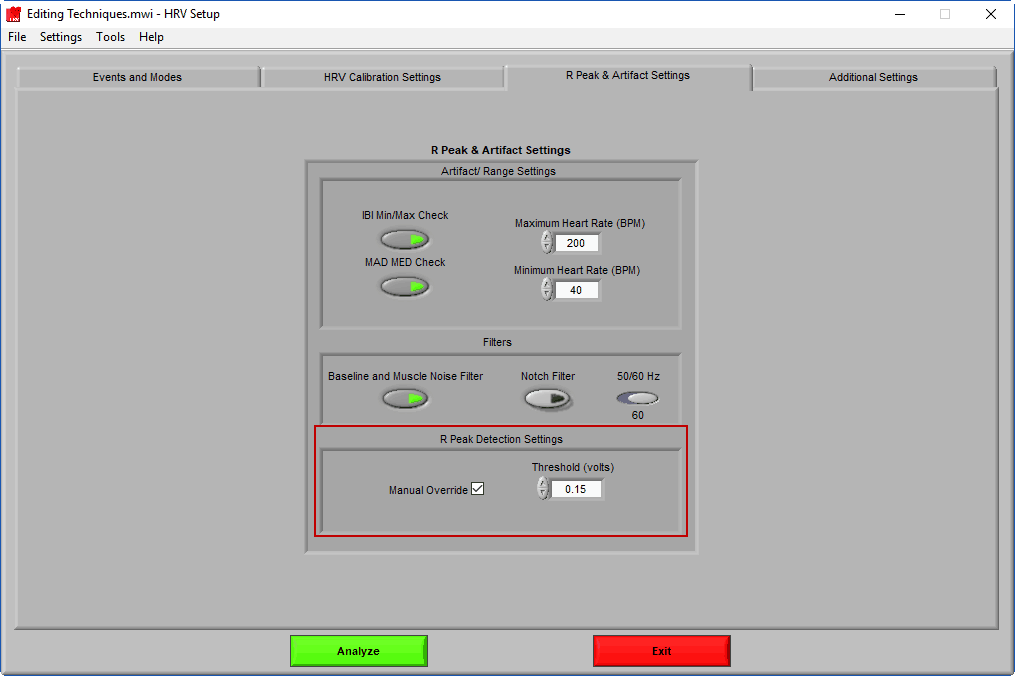
Manual Override bypasses the Shannon Energy Envelope algorithm and simply looks for any peak which falls above the specified voltage threshold. This peak detection method is used less often but is great for specific situations.
Q Point Detection
We have talked a lot about the R peak, and it will continue to dominate this blog series until we get to discussing arrhythmia, but don’t forget about the other components of ECG. While mainly only useful to identify visually for HRV analysis, these points are actually used to derive key statistics for impedance cardiography. In particular, the Q point (characterized by the trough immediately preceding the R peak) is used to determine pre-ejection period, or PEP.
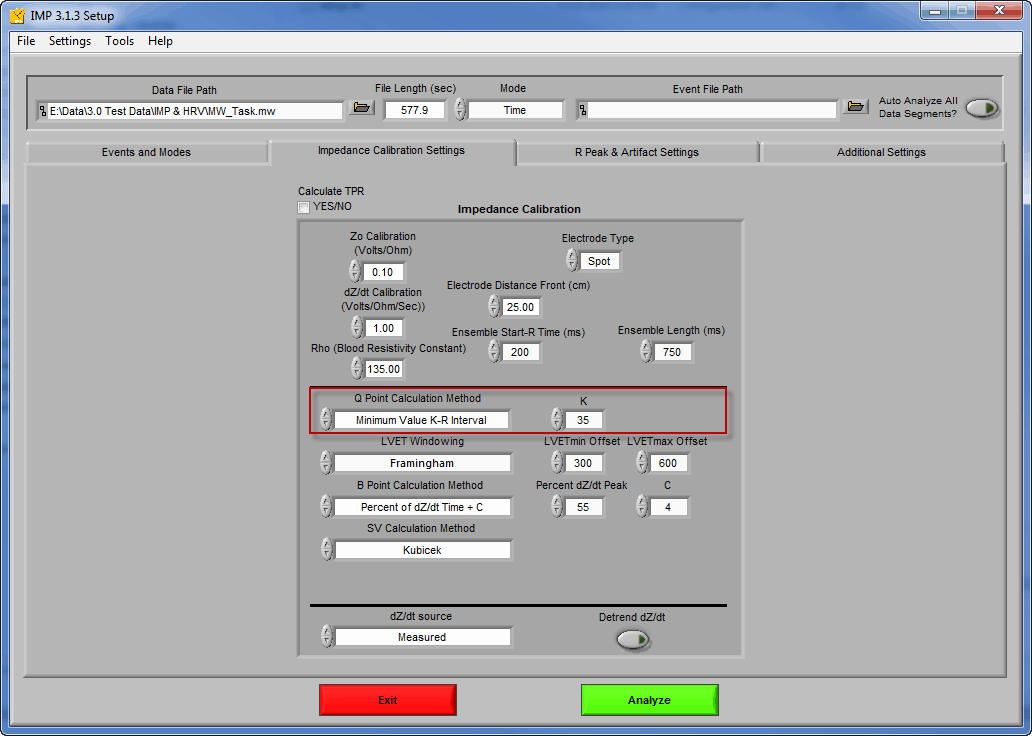
The IMP analysis application offers 3 ways to identify the Q point:
- R Minus Constant: Places the Q point at an exact location (in milliseconds) prior to the identified R peak. This method is useful if the Q point is not visible or too noisy.
- Max Slope Change: This method looks for the point on the ECG waveform where the change in slope is greatest. Typically this is the point in the signal where it begins to rise toward the R peak. Use this method if the trough which characterizes Q is not visible.
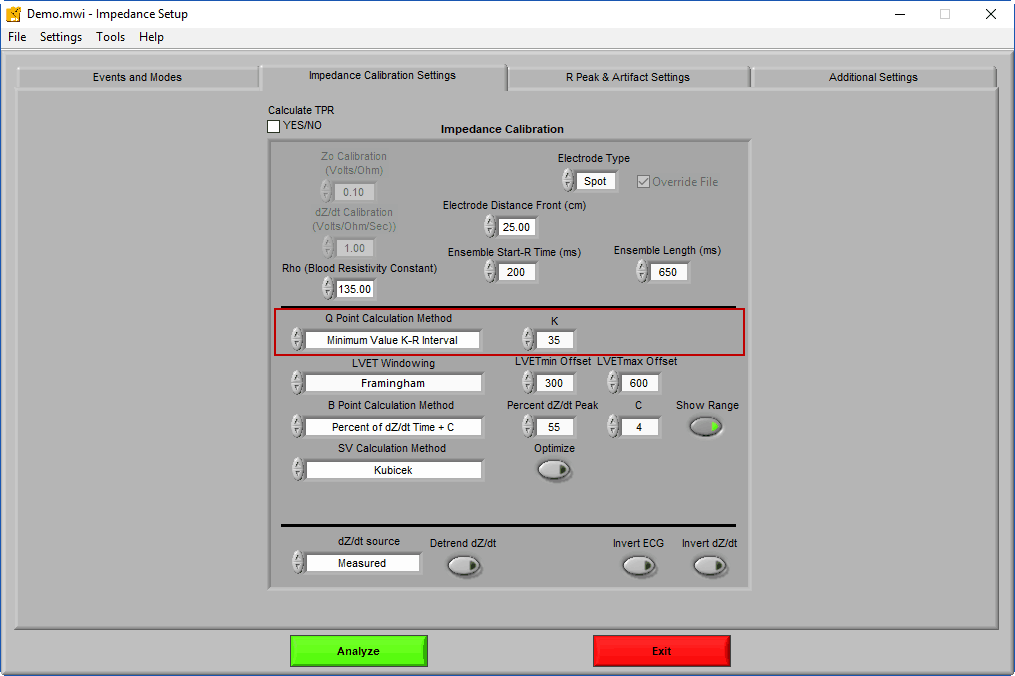
- Minimum Value K-R Interval: The Q point will be placed at the lowest point of the signal found within a certain millisecond window prior to the R peak. This is the default method and the most commonly used. This method is great for when the Q trough is clearly identifiable.
Helpful Hints
- R peaks can be marked as either blue or yellow. Blue means they fit the timing criteria of the artifact detection algorithms (stay tuned for more on this topic) and are probably good R peaks, yellow means you should investigate further.
- There are several options for how R and Q points are identified within the MindWare analysis applications. Use them to your advantage to save time.
- The R peak is the most important component to locate, but be aware of the other identifiable components of the ECG waveform. The better you get at analyzing ECG data, and the further we go in this blog series, the more they will mean to you.
Next time we will talk more about blue and yellow markers on R peaks, what they mean, and the algorithms used to identify them as such.