All About ECG
The ECG, or electrocardiogram (also EKG), is a measure of the electrical activity of the heart. The recording and interpretation of the ECG signal yields several statistics that prove meaningful in the realm of psychophysiology. To examine activity in the parasympathetic nervous system, we can examine heart rate and respiratory sinus arrhythmia (an index of heart rate variability). When collected simultaneously with cardiac impedance, we can measure sympathetic nervous system activation through the derivation of pre-ejection period, stroke volume, and cardiac output.
Being as it is such an important signal, it is critical that we understand how to interpret ECG. In this series of blog posts, we are going to discuss the components of an ECG waveform, artifact identification, basic signal editing techniques for HRV and impedance cardiography (each of which have a different approach), and more advanced editing when dealing with cardiac conditions and arrhythmia. It is my hope that when we are done you will have the tools and knowledge necessary to confidently analyze ECG data in a multitude of scenarios.
I won’t bore you with the history of the electrocardiogram, but to develop a firm foundation upon which we can build, we need to discuss the standard morphology of an ECG and how to identify key components of the waveform.
Components of ECG
In the realm of medical/clinical cardiology, a 12-lead ECG is often used to capture the activity of the heart from many angles. The 12-lead approach, while great for medical diagnosis, is unnecessary for studying heart rate variability and impedance cardiography. For these types of analysis we can simply do a 3-electrode configuration, known as a Lead II configuration, which produces a pronounced and consistently identifiable fiducial point (in this case an R peak, which we will discuss in a moment). The following is a depiction of a typical cycle of ECG when collected in this fashion:
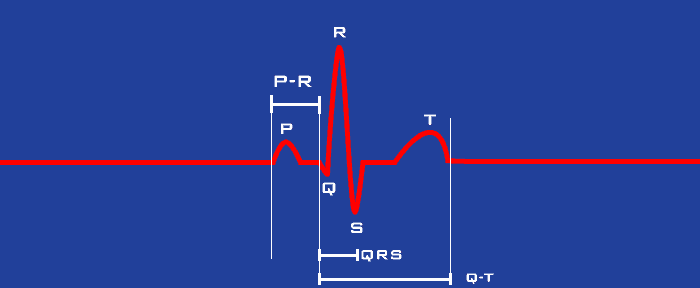
On the graph above, you will notice there are several components of the waveform which have been labeled with the letters P, Q, R, S, and T. It is less important to understand the physiologic reasoning for this morphology right now, but it is most definitely important to be able to visually identify these components and their relative timing. For heart rate variability and impedance cardiography, the R peak is the single most important component to identify. If this is identifiable, everything else will fall into place. The R peak will be the focal point (no pun intended) for the next couple of blog posts in this series, but we will revisit the other components more when we talk about identifying cardiac conditions and arrhythmia.
Helpful Hints
- The electrocardiogram is an important signal for understanding sympathetic/parasympathetic nervous system activity.
- Understand what a good ECG waveform looks like. Print it out and pin it on the wall! This is important during data analysis, but arguably even more so during data acquisition. The signal doesn’t have to be perfect, but you should at least be able to visually identify an R peak.
- For more information on the optimal electrode placement to achieve a pronounced R peak, check out the MindWare Electrode Placement poster.
Next time we will discuss how key components on the ECG waveform are identified, and the various options for doing so in the MindWare analysis applications.