Detecting the R peak on the ECG waveform is crucial to deriving statistics related to Heart Rate Variability (HRV) and Impedance Cardiography (IMP). In the MindWare HRV and IMP applications, you will find a tab labeled R Peak and Artifact Settings which contains within it settings related to the automatic R peak identification in the application. Setting these properly can minimize editing time and reduce potential error.
Select analysis version to view the applicable content:
By default, the HRV and IMP applications automatically detect R peaks based on an algorithm which takes into account expected characteristics of an R peak including:
- Slope of waveform ascent
- Sharpness of peak
- Amplitude of peak relative to the rest of the waveform
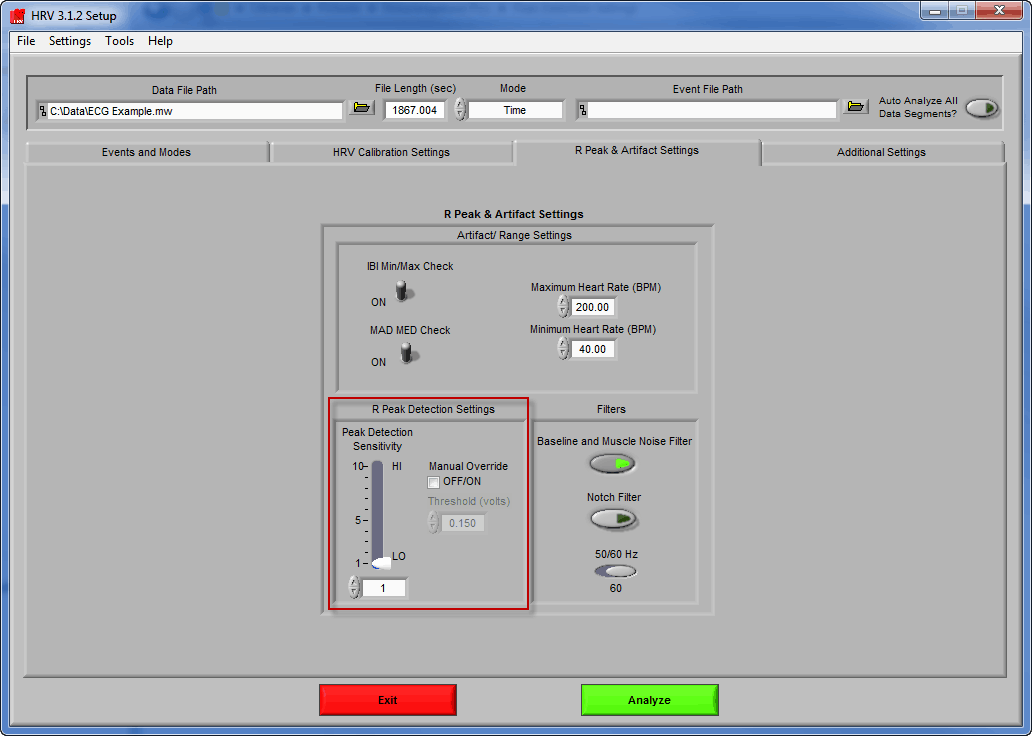
The adjustable parameter for this algorithm is the Peak Detection Sensitivity, which allows you to specify how precisely a peak needs to fit the above criteria for it to be marked as an R peak. The lower the sensitivity, the most closely it must match the expected characteristics of an R peak.
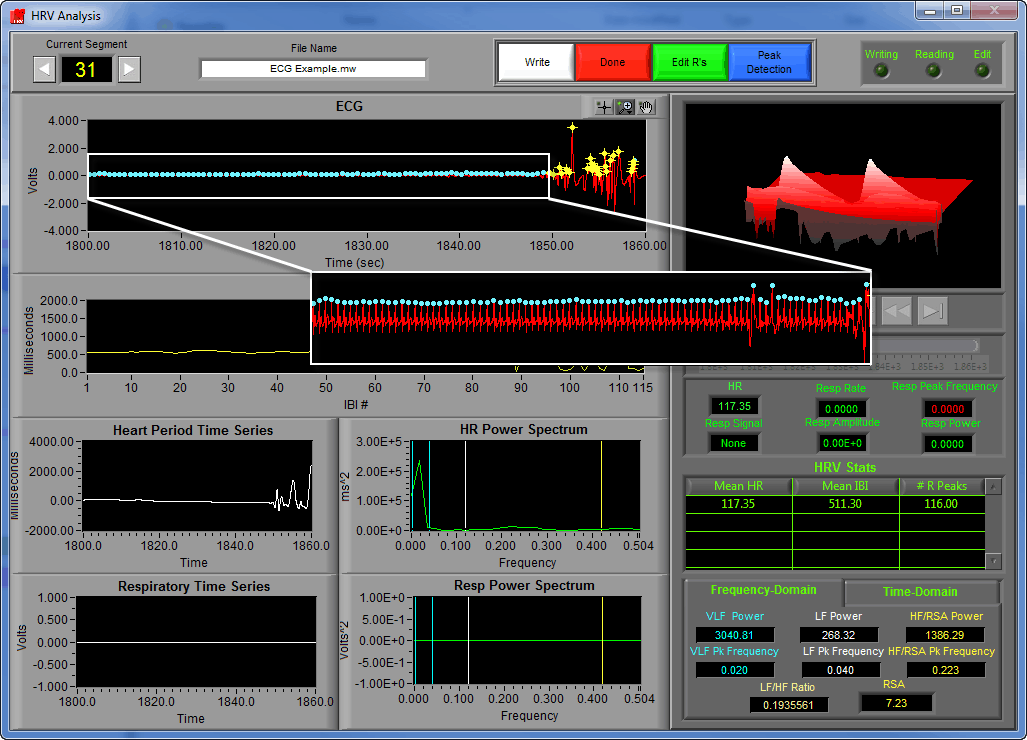
The default peak detection algorithm works great for the majority of ECG signals, but certain irregularities in the signal can render the algorithm less effective. Take for example a large amplitude spike in the ECG waveform:
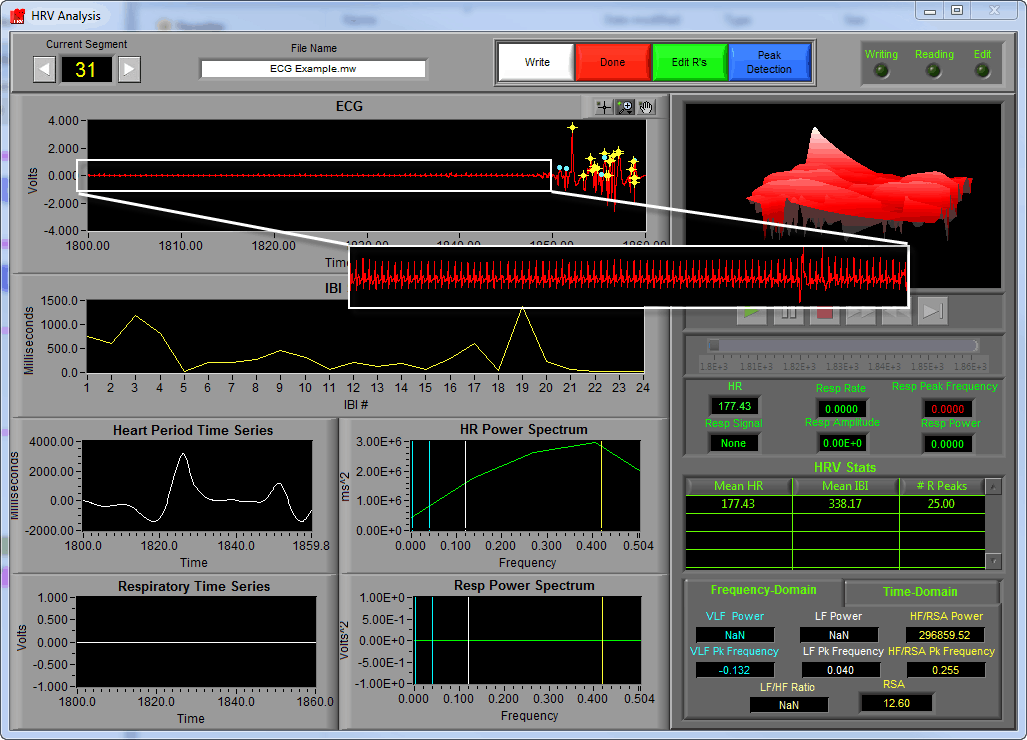
In this situation, the large amplitude spike has disrupted the algorithm in such a way that peaks which are clearly visually identified as R peaks have not been marked as such. Of course you could manually insert each of these peaks using the R Peak Editor, but a much faster way would be to change the peak detection algorithm to Manual Override.
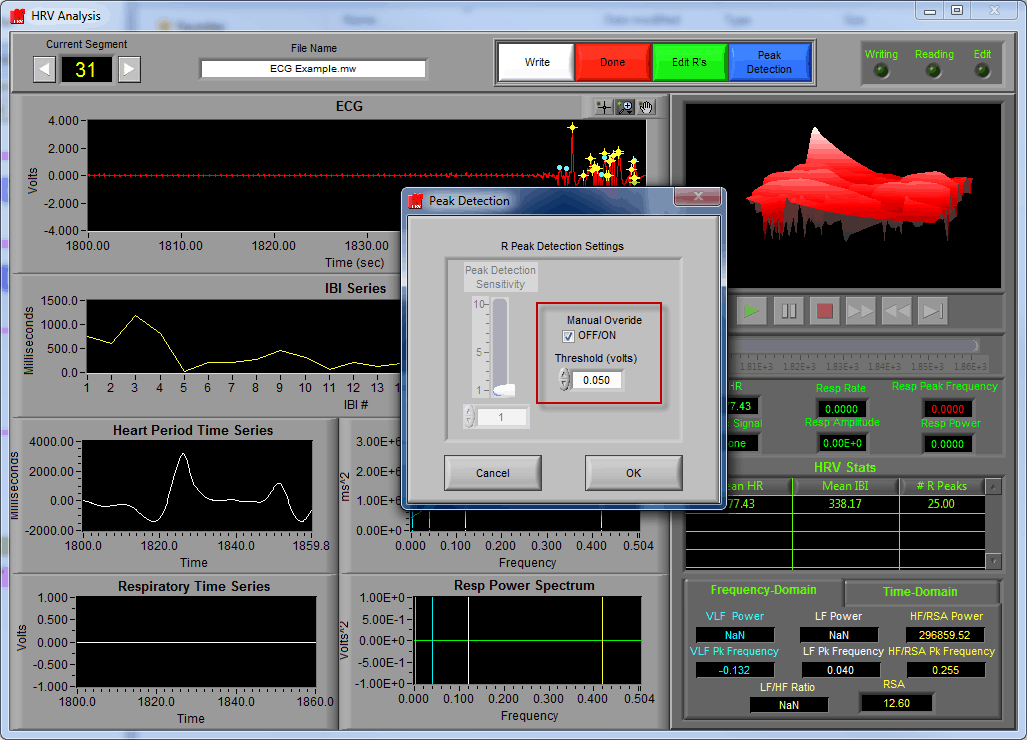
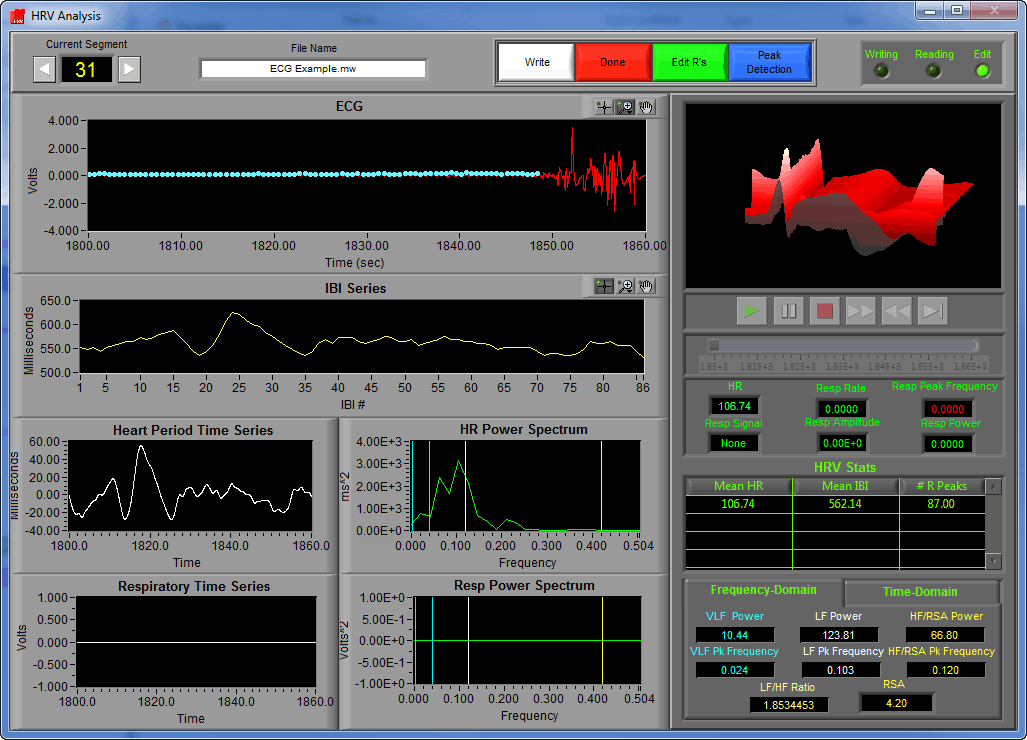
Manual Override peak detection simply identifies all peaks found above a given voltage threshold as an R peak. While this isn’t necessarily ideal for an ECG waveform with baseline movement (which can be helped by enabling the Baseline and Muscle Noise Filter found on the same tab), it is great for the signal seen in the example above. By setting the voltage threshold appropriately, we go from many manual peak insertions to a single manual point deletion.
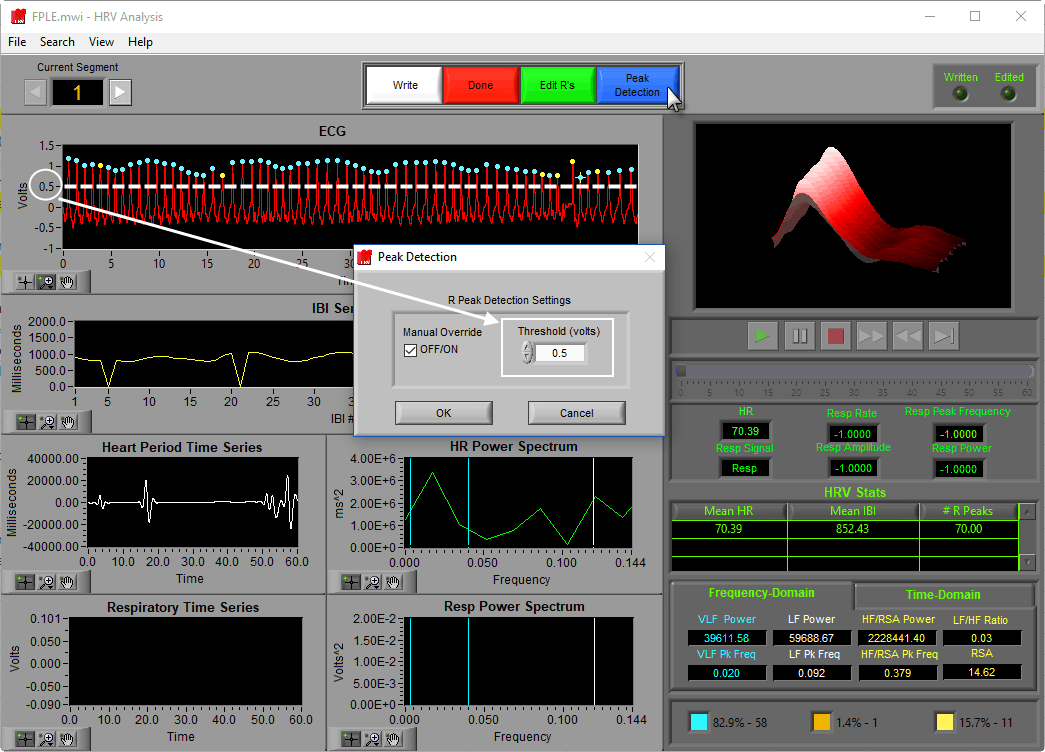
Note – The Peak Detection Settings can be modified on a segment-by-segment basis depending on the signal characteristics of the given segment by pressing the Peak Detection button on the analysis screen. The chosen settings are reported in the Excel output file for each segment as well.
Now with a single simple edit, the segment is usable.
By default, the application will automatically detect R peaks using the Shannon Energy Envelope technique which has been shown to be highly successful even in difficult situations such as motion artifact and abnormal morphology. If you have a particularly abnormal ECG series, or you are using a different signal to study HRV (such as plethysmography), you may want to instead use an absolute threshold peak detector. To do this, enable Manual Override on the R Peak & Artifact Settings tab and adjust the Threshold (volts) to just below the expected fiducial point amplitude.
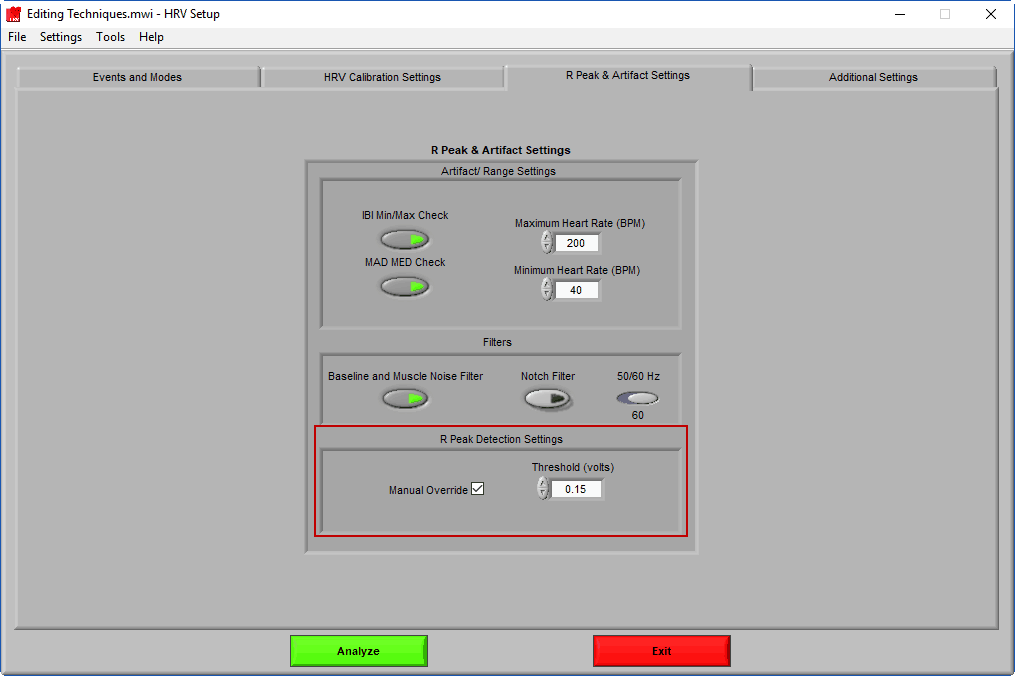
This may be easier to determine when actually looking at the data. These peak detection settings are also available from the analysis screen by pressing the blue Peak Detection button.